DevOps Pipeline Diagram
Introduction
In the ever-evolving world of software development, delivering high-quality applications quickly and reliably is a top priority for organizations. DevOps, a cultural and technical movement that bridges development and operations, has become the cornerstone of achieving this goal. At the heart of DevOps lies the DevOps pipeline—a structured workflow that automates and streamlines the software delivery process. A well-designed DevOps pipeline diagram visually represents this workflow, providing clarity and alignment for teams. Tools like monday.com — a versatile DevOps software—play a pivotal role in managing and visualizing these pipelines. This article delves into the intricacies of DevOps pipeline diagrams, their components, creation process, and their integration with tools like monday.com, offering a comprehensive guide to leveraging them for success.
Understanding the DevOps Pipeline
A DevOps pipeline is a set of automated processes that guide software from development to production. It encompasses stages like coding, building, testing, deploying, and monitoring, ensuring seamless collaboration and continuous delivery. A DevOps pipeline diagram is a visual representation of these stages, illustrating the flow of code and the tools involved at each step.
Why DevOps Pipeline Diagrams Matter
DevOps pipeline diagrams are more than just visual aids; they are critical tools for aligning teams and optimizing workflows. Key benefits include:
- Clarity: Diagrams provide a clear overview of the pipeline, making it easier for teams to understand processes.
- Collaboration: By visualizing workflows, diagrams foster cross-functional collaboration between developers, testers, and operations teams.
- Efficiency: Identifying bottlenecks or redundancies in the pipeline becomes simpler with a clear diagram.
- Onboarding: New team members can quickly grasp the delivery process through a well-structured diagram.
- Tool Integration: Diagrams highlight where tools like monday.com fit into the pipeline, ensuring seamless integration.
With these benefits in mind, let’s explore the components of a DevOps pipeline diagram and how to create one effectively.
Components of a DevOps Pipeline Diagram
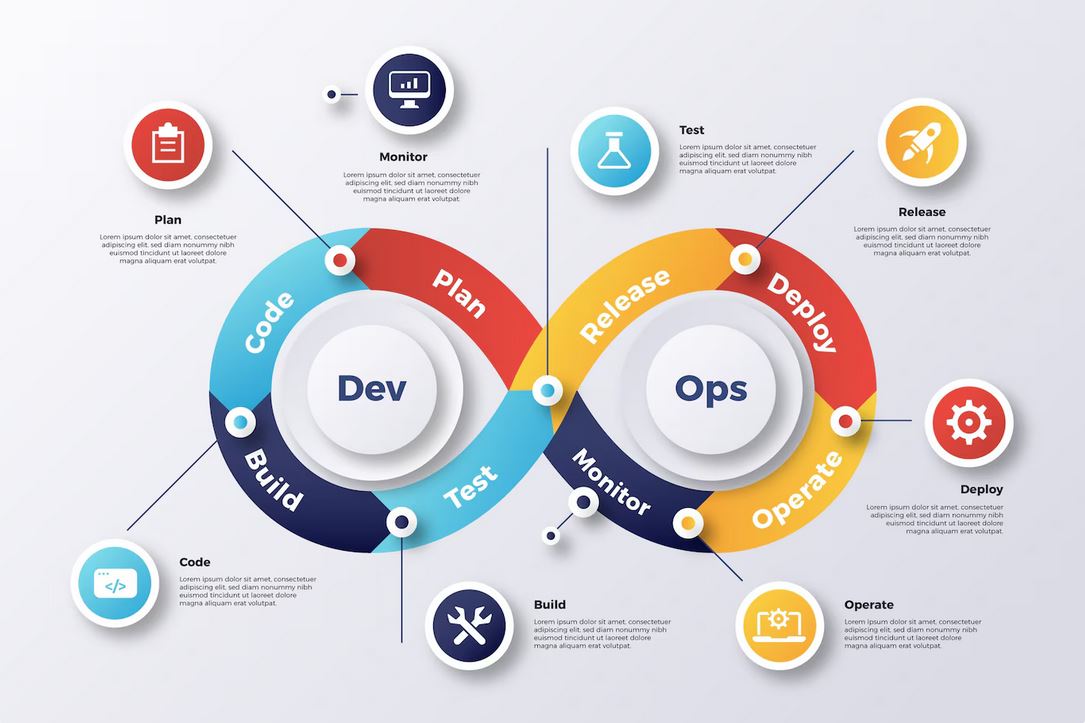
A DevOps pipeline diagram typically includes several stages, each representing a critical step in the software delivery process. Below are the core components, often referred to as the CI/CD (Continuous Integration/Continuous Deployment) pipeline, along with their roles.
1. Plan
The planning stage involves defining requirements, creating tasks, and setting goals. Teams collaborate to prioritize features and plan sprints. Tools like monday.com excel here, offering customizable boards to track tasks and manage backlogs.
- Activities: Requirement gathering, sprint planning, task assignment.
- Tools: monday.com, Jira, Trello.
- Diagram Representation: A box or node labeled “Plan,” often the starting point of the pipeline.
2. Code
In the coding stage, developers write and commit code to a version control system. This stage emphasizes collaboration and code quality.
- Activities: Writing code, branching, and committing changes.
- Tools: Git, GitHub, GitLab, Bitbucket.
- Diagram Representation: A node labeled “Code” connected to version control tools, showing code commits.
3. Build
The build stage compiles code, packages it, and prepares it for testing. Automation is key to ensuring consistency and speed.
- Activities: Compiling code, generating artifacts, running build scripts.
- Tools: Jenkins, Maven, Gradle.
- Diagram Representation: A “Build” node linked to the code stage, often with arrows indicating automation.
4. Test
Testing ensures code quality through automated and manual tests, including unit, integration, and performance tests.
- Activities: Running test suites, validating functionality, ensuring security.
- Tools: Selenium, JUnit, Postman.
- Diagram Representation: A “Test” node with branches for different test types.
5. Deploy
The deployment stage involves releasing code to staging or production environments. Continuous deployment automates this process for rapid releases.
- Activities: Deploying to servers, rolling out updates, managing environments.
- Tools: Kubernetes, Docker, Ansible.
- Diagram Representation: A “Deploy” node with arrows to staging and production environments.
6. Monitor
Monitoring tracks application performance, errors, and user feedback in production, enabling continuous improvement.
- Activities: Collecting metrics, logging errors, analyzing user behavior.
- Tools: Prometheus, Grafana, New Relic.
- Diagram Representation: A “Monitor” node with feedback loops to the planning stage.
7. Feedback Loop
A critical aspect of DevOps is the feedback loop, which connects monitoring back to planning, ensuring iterative improvements.
- Activities: Analyzing metrics, addressing issues, planning enhancements.
- Tools: monday.com for tracking feedback, Slack for communication.
- Diagram Representation: Arrows looping back from “Monitor” to “Plan.”
By mapping these components in a diagram, teams gain a holistic view of the pipeline, making it easier to integrate tools like monday.com for task management and collaboration.
Creating a DevOps Pipeline Diagram: A Step-by-Step Guide
Designing an effective DevOps pipeline diagram requires careful planning and collaboration. Below is a structured approach to creating one.
1. Define Objectives
Before creating a diagram, clarify the pipeline’s purpose. Are you aiming to visualize the entire CI/CD process or focus on a specific stage? For example, a team using monday.com might prioritize visualizing task management within the planning and monitoring stages.
2. Identify Pipeline Stages
List the stages relevant to your organization’s workflow. While the components above (Plan, Code, Build, Test, Deploy, Monitor) are standard, some organizations may include additional stages like security scanning or code review.
3. Map Tools and Processes
For each stage, identify the tools and processes involved. For instance:
- Plan: Use monday.com to create task boards and assign responsibilities.
- Code: Use GitHub for version control.
- Build: Use Jenkins for automated builds.
- Test: Use Selenium for automated testing.
- Deploy: Use Kubernetes for containerized deployments.
- Monitor: Use Prometheus for performance monitoring.
4. Choose a Visualization Tool
Select a tool to create the diagram. Popular options include:
- Lucidchart: Offers templates for DevOps pipelines.
- Draw.io: A free, web-based diagramming tool.
- Visio: Ideal for enterprise environments.
- monday.com: While primarily a project management tool, its visual boards can be adapted to represent pipeline stages.
5. Design the Diagram
Create a clear, intuitive diagram with the following elements:
- Nodes: Represent each pipeline stage (e.g., Plan, Code, Build).
- Arrows: Show the flow of code between stages.
- Tool Icons: Include icons or labels for tools like monday.com or Jenkins.
- Feedback Loops: Indicate iterative processes with backward arrows.
- Annotations: Add notes to explain complex processes or tool integrations.
For example, a simple diagram might show a linear flow from “Plan” to “Monitor,” with monday.com integrated at the planning and feedback stages.
6. Validate with Stakeholders
Share the diagram with developers, operations teams, and leadership to ensure accuracy and alignment. Incorporate feedback to refine the diagram.
7. Maintain and Update
As processes or tools evolve, update the diagram to reflect changes. For instance, adopting a new monitoring tool like Grafana should be reflected in the diagram.
Integrating monday.com into the DevOps Pipeline Diagram
monday.com is a powerful DevOps software that enhances pipeline visibility and collaboration. Its flexibility makes it an ideal tool for managing tasks across pipeline stages.
How monday.com Fits into the Pipeline
- Planning Stage: monday.com’s boards allow teams to create backlogs, assign tasks, and track sprint progress. For example, a “Sprint Planning” board can list features, bugs, and technical debt.
- Code and Build Stages: While monday.com doesn’t directly handle coding or builds, it can track related tasks, such as code reviews or build script updates.
- Test Stage: Teams can use monday.com to manage test cases, assign testing tasks, and track defects.
- Deploy Stage: monday.com can coordinate deployment schedules and track rollback plans.
- Monitor Stage: Dashboards in monday.com visualize performance metrics, while automations notify teams of issues.
- Feedback Loop: monday.com facilitates feedback by centralizing user stories, bug reports, and improvement suggestions.
Visualizing monday.com in the Diagram
In a pipeline diagram, monday.com can be represented as a node or annotation at relevant stages. For example:
- Plan Node: Include a monday.com icon to indicate task management.
- Monitor Node: Show monday.com as a tool for tracking feedback and metrics.
- Arrows: Connect monday.com to other tools like Jenkins or Slack to show integrations.
By integrating monday.com, teams can streamline communication and ensure all pipeline stages are aligned.
Best Practices for DevOps Pipeline Diagrams
To maximize the effectiveness of a DevOps pipeline diagram, consider the following best practices:
- Keep It Simple: Avoid clutter by focusing on key stages and tools. Use clear labels and minimal text.
- Highlight Automation: Emphasize automated processes, such as CI/CD pipelines, to showcase efficiency.
- Incorporate Feedback Loops: Show how monitoring informs planning to emphasize continuous improvement.
- Use Consistent Icons: Standardize tool icons (e.g., monday.com, Jenkins) for clarity.
- Update Regularly: Revise the diagram as processes or tools change to maintain relevance.
- Share Widely: Distribute the diagram to all stakeholders to ensure alignment and transparency.

Challenges in Designing DevOps Pipeline Diagrams
While DevOps pipeline diagrams are invaluable, creating them comes with challenges:
- Complexity: Large organizations with multiple teams and tools may struggle to create a concise diagram.
- Tool Integration: Ensuring all tools, like monday.com and Jenkins, are accurately represented can be difficult.
- Stakeholder Alignment: Differing perspectives among teams may lead to disagreements on pipeline structure.
- Maintenance: Keeping diagrams up-to-date as processes evolve requires ongoing effort.
- Visualization Tools: Choosing the right diagramming tool can be overwhelming, especially for non-technical teams.
To address these challenges, start with a simple diagram, involve all stakeholders, and leverage tools like monday.com to centralize pipeline-related tasks.
Case Study: Building a DevOps Pipeline Diagram with monday.com
Consider a tech startup aiming to accelerate its release cycle. The team struggled with misaligned workflows and lacked visibility into the delivery process. To address this, they created a DevOps pipeline diagram.
Process
- Planning: The team used monday.com to create a sprint planning board, outlining features and tasks.
- Coding: Developers committed code to GitHub, with monday.com tracking code review tasks.
- Building: Jenkins automated builds, with status updates reflected in monday.com.
- Testing: Selenium ran automated tests, and monday.com tracked test case progress.
- Deploying: Kubernetes handled deployments, with monday.com managing schedules.
- Monitoring: Prometheus monitored performance, and monday.com visualized metrics.
Diagram Creation
Using Lucidchart, the team created a diagram with nodes for each stage, connected by arrows. monday.com was represented at the planning and monitoring stages, with integrations to Jenkins and Slack. Feedback loops showed how monitoring data informed future sprints.
Results
The diagram provided clarity, reducing miscommunication and accelerating releases by 40%. monday.com’s centralized task management improved collaboration, demonstrating the value of a well-designed pipeline diagram.
Advanced Considerations for DevOps Pipeline Diagrams
For organizations with complex needs, advanced considerations can enhance pipeline diagrams:
- Microservices Architecture: Represent multiple pipelines for microservices, showing parallel workflows.
- Security Integration: Include security scanning (e.g., Snyk) as a distinct stage.
- Scalability: Design diagrams to accommodate future growth, such as additional environments.
- Cloud Integration: Highlight cloud platforms like AWS or Azure in the deployment stage.
- Metrics Visualization: Use monday.com dashboards to visualize DORA metrics (e.g., deployment frequency) alongside the diagram.
Conclusion
A DevOps pipeline diagram is a powerful tool for visualizing and optimizing the software delivery process. By mapping out stages like planning, coding, building, testing, deploying, and monitoring, organizations can align teams, identify bottlenecks, and integrate tools like monday.com for seamless collaboration. Despite challenges like complexity and maintenance, following best practices and leveraging versatile software ensures diagrams remain effective. As organizations embrace DevOps to stay competitive, a well-crafted pipeline diagram, supported by tools like monday.com, will continue to drive efficiency and innovation in software delivery.
You might also be interested in DevOps Research and Assessment