Master Website Performance Optimization for Success

Website speed is everything, and even a few seconds can cost you visitors. Studies show that media files make up over 70 percent of all downloaded website bytes. Most people assume shaving off a little image weight or tweaking some scripts is enough. The real surprise is that the biggest wins come from a mix of hidden steps that most sites ignore altogether.
Table of Contents
- Step 1: Analyze Your Current Performance Metrics
- Step 2: Identify and Optimize Resource Bottlenecks
- Step 3: Implement Caching and Content Delivery Solutions
- Step 4: Optimize Images and Media Files for Speed
- Step 5: Conduct Comprehensive Testing and Verification
- Step 6: Monitor Performance and Adjust Continuously
Quick Summary
| Key Point | Explanation |
|---|---|
| 1. Assess Website Performance Metrics | Use tools like Google PageSpeed Insights to analyze your site’s loading time and user experience metrics. |
| 2. Identify Resource Bottlenecks | Utilize browser developer tools to pinpoint and optimize slow-loading images and scripts that hinder performance. |
| 3. Implement Caching Solutions | Set up browser caching and use CDNs to reduce server load and speed up content delivery for users. |
| 4. Optimize Images and Media | Apply image compression and responsive strategies to reduce file sizes and loading times without sacrificing quality. |
| 5. Continuously Monitor Performance | Use real-time monitoring tools to track performance metrics and adjust strategies proactively for ongoing optimization. |
Step 1: Analyze Your Current Performance Metrics
Successful website performance optimization begins with a comprehensive understanding of your current digital landscape. Before implementing any improvements, you need a clear snapshot of your website’s existing performance metrics. This initial assessment will serve as your strategic baseline, guiding subsequent optimization efforts with precision and insight.
Starting your performance analysis requires selecting the right diagnostic tools. Google PageSpeed Insights emerges as a powerful free resource that provides immediate, actionable feedback about your website’s speed and user experience. By inputting your website URL, you’ll receive a detailed report highlighting critical performance indicators like loading time, interactivity, and visual stability.
To conduct a thorough performance evaluation, focus on several key metrics that collectively paint a comprehensive picture of your website’s health. Loading speed represents your first crucial metric, measuring how quickly your web pages render content for visitors. Aim for load times under 3 seconds, as research from Google’s Web Fundamentals demonstrates that longer load times dramatically increase visitor bounce rates.
Beyond speed, examine Core Web Vitals which Google uses to assess user experience. These include:
- Largest Contentful Paint (LCP): Measures loading performance
- First Input Delay (FID): Evaluates interactivity
- Cumulative Layout Shift (CLS): Assesses visual stability
Utilize tools like Chrome DevTools and professional performance monitoring platforms to capture these metrics comprehensively. Each measurement provides insights into potential optimization opportunities, revealing bottlenecks in your website’s infrastructure that might impede user experience and search engine rankings.
Remember that performance analysis is not a one-time task but an ongoing process. Regular monitoring allows you to track improvements, identify emerging issues, and maintain your website’s competitive digital presence. By establishing a systematic approach to performance metrics, you’re laying the groundwork for strategic, data-driven optimization that will enhance user satisfaction and support your broader digital objectives.
Step 2: Identify and Optimize Resource Bottlenecks
After establishing your baseline performance metrics, the next critical phase in website performance optimization involves identifying and systematically addressing resource bottlenecks. These bottlenecks represent specific elements that slow down your website’s loading and responsiveness, creating friction in user experience and potentially impacting search engine rankings.
Browser developer tools emerge as your primary investigative instrument for uncovering performance limitations. Chrome DevTools provides an incredibly detailed diagnostic environment where you can analyze network requests, rendering times, and resource consumption. By examining the network waterfall view, you’ll pinpoint exactly which assets require the most time to load and transfer, revealing opportunities for targeted optimization.
Image and multimedia resources frequently represent the most significant performance constraints. Large, uncompressed images can exponentially increase page load times, creating substantial user experience challenges. Implement strategic image optimization techniques such as compression, selecting appropriate file formats, and utilizing modern image formats like WebP. Modern browsers support WebP, which offers superior compression compared to traditional JPEG and PNG formats without sacrificing visual quality.
JavaScript and CSS files also contribute significantly to performance bottlenecks. Minimize and concatenate these resources to reduce total HTTP requests. Tools like webpack and gulp can automate this process, combining multiple script files into single, streamlined packages. Additionally, consider implementing lazy loading for non-critical resources, which defers loading of off-screen content until users scroll, dramatically improving initial page render speed.
According to performance research from ACM Digital Library, network latency and connection establishment times represent critical performance constraints beyond simple file sizes. This means your optimization strategy must extend beyond file compression to include efficient content delivery mechanisms.
Verify your optimization efforts by re-running performance tests after each modification. Look for measurable improvements in:
- Total page load time
- Resource transfer sizes
- Number of HTTP requests
- Time to first meaningful paint
Remember that resource optimization is an iterative process. Continuous monitoring and incremental improvements will gradually transform your website into a high-performance digital platform that delivers exceptional user experiences.
Step 3: Implement Caching and Content Delivery Solutions
Caching represents a transformative strategy in website performance optimization, acting as a powerful mechanism to dramatically reduce server load and accelerate content delivery. By strategically storing frequently accessed web resources, you create a high-speed pathway for delivering content to users, minimizing redundant processing and network transmission times.
Browser-level caching provides the first line of defense in performance enhancement. Configure your web server to send precise cache-control headers that instruct browsers how long specific resources can be stored locally. Static assets like images, CSS, and JavaScript files are perfect candidates for extended caching periods. Implement versioning or unique file names for resources that change frequently, ensuring users always receive the most current content while maintaining robust caching mechanisms.
Content Delivery Networks (CDNs) represent the next evolutionary step in performance optimization. These distributed server networks strategically place cached versions of your website across multiple global locations, allowing users to retrieve content from geographically proximate servers. Geographic proximity translates directly into reduced latency and faster loading times. Popular CDN providers like Cloudflare offer seamless integration, automatically distributing and caching your static content across international server networks.
Server-side caching technologies like Redis and Memcached provide advanced performance acceleration for dynamic content. These in-memory caching systems store frequently requested database queries and computational results, significantly reducing backend processing times. By implementing intelligent caching strategies, you can reduce database load and create near-instantaneous response times for recurring user requests.
According to research from ACM Digital Library, adaptive caching techniques that dynamically adjust cache parameters can dramatically improve content delivery efficiency. This means your caching strategy should not be static but continuously evolve based on usage patterns and traffic dynamics.
Verify your caching implementation’s effectiveness by monitoring key performance indicators:
- Reduced server response times
- Decreased bandwidth consumption
- Improved page load speeds
- Lower server resource utilization
Remember that caching is both an art and a science. Continuously experiment with different caching strategies, monitor their impact, and be prepared to refine your approach.
 The goal is creating a dynamic, responsive web experience that feels instantaneous to your users while maintaining optimal backend efficiency.
Step 4: Optimize Images and Media Files for Speed
Images and media files represent the most substantial performance bottlenecks for modern websites, consuming significant bandwidth and potentially slowing down user experiences. Strategic optimization of these visual assets becomes crucial in maintaining rapid, responsive web interfaces that keep visitors engaged and satisfied.
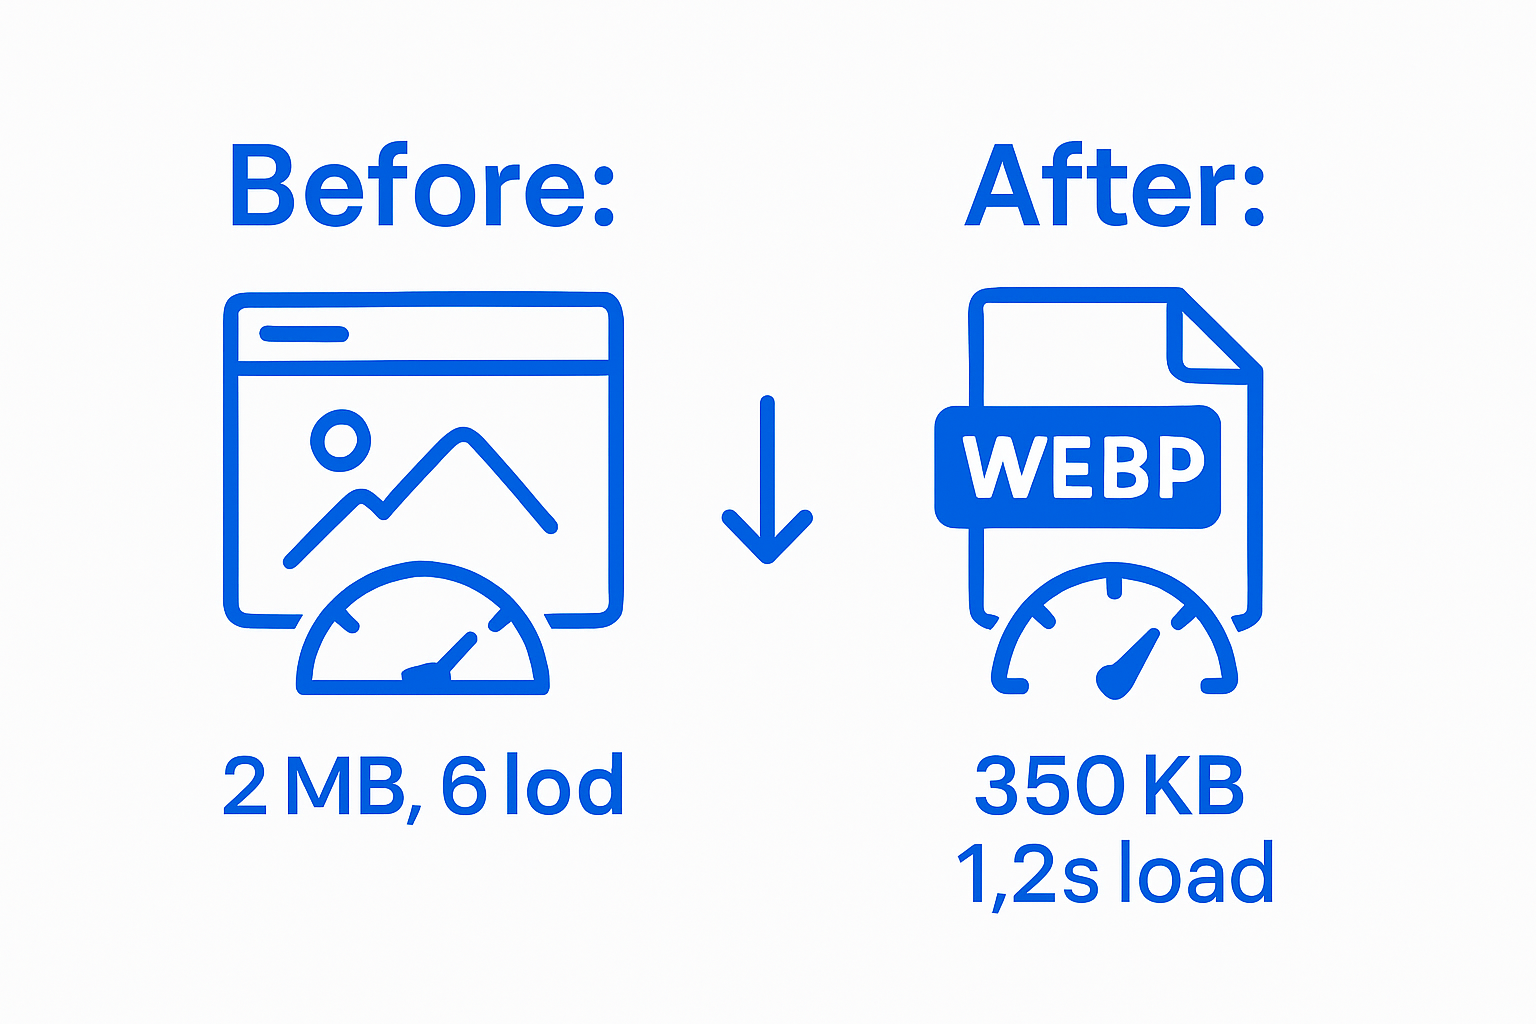
Image compression emerges as your primary optimization technique. Modern tools like TinyPNG and ImageOptim provide intelligent compression algorithms that dramatically reduce file sizes without perceptible quality loss. When selecting an image format, prioritize WebP for web graphics, as this modern format offers superior compression compared to traditional JPEG and PNG files. Most contemporary browsers now support WebP, enabling you to deliver smaller, faster-loading visual content.
Implement responsive image strategies that serve appropriately sized images based on device characteristics. Instead of uploading massive high-resolution images and scaling them down, create multiple image versions tailored to different screen sizes and resolutions. HTML5’s “srcset” attribute allows browsers to intelligently select the most appropriate image variant, reducing unnecessary data transfer and improving loading performance.
For video and multimedia content, consider lazy loading techniques that defer media file loading until they enter the user’s viewport. This approach prevents unnecessary bandwidth consumption and accelerates initial page rendering. JavaScript libraries like Lozad.js provide simple, efficient mechanisms for implementing lazy loading across various media types.
According to performance research from Mozilla Developer Network, media files constitute over 70% of downloaded website bytes. This statistic underscores the critical importance of robust media optimization strategies in contemporary web development.
Verify your media optimization efforts by examining these key performance indicators:
- Reduced total page weight
- Faster initial page load times
- Lower bandwidth consumption
- Maintained visual quality across devices
Remember that media optimization is an ongoing process. Regularly audit your visual assets, experiment with newer compression technologies, and stay informed about emerging web performance standards. Your goal is creating a visually rich web experience that feels instantaneous and seamless across all devices and network conditions.
Step 5: Conduct Comprehensive Testing and Verification
Comprehensive testing represents the critical validation phase of website performance optimization, transforming theoretical improvements into measurable, real-world enhancements. This step ensures that your meticulously implemented optimizations translate into tangible performance gains across diverse user scenarios and device environments.
Performance testing tools like Google PageSpeed Insights, GTmetrix, and WebPageTest provide comprehensive diagnostic capabilities that simulate various network conditions and device configurations. These platforms generate detailed reports highlighting potential performance bottlenecks, offering actionable insights into your website’s responsiveness, loading speed, and overall user experience. Pay special attention to metrics such as First Contentful Paint, Time to Interactive, and Total Blocking Time, which offer nuanced perspectives on your website’s performance characteristics.
Load testing becomes essential for understanding your website’s behavior under stress. Utilize tools like Apache JMeter and Loader.io to simulate multiple concurrent user sessions, identifying potential scaling limitations and infrastructure weaknesses. By creating realistic traffic scenarios, you can proactively discover and address performance degradation points before they impact real-world user experiences. Focus on testing different user interaction patterns, varying network speeds, and diverse device types to ensure comprehensive coverage.
Cross-browser and cross-device compatibility testing cannot be overlooked. Modern websites must deliver consistent performance across desktop browsers, mobile devices, and tablet interfaces. Browser developer tools provide emulation environments that allow you to test responsive design and performance characteristics without requiring physical device access. Additionally, cloud-based testing platforms like BrowserStack offer extensive device and browser combination testing, ensuring your optimization efforts maintain consistency across the digital ecosystem.
According to performance research from GTmetrix Performance Analysis, systematic testing and verification can reveal performance improvements of up to 40% through targeted optimizations. This underscores the transformative potential of rigorous performance testing.
Verify your testing efforts by examining these critical indicators:
- Consistent performance across multiple browsers
- Stable load times under simulated traffic
- Minimal performance variance between devices
- Achievement of target performance metrics
Remember that testing is not a one-time event but an ongoing process. Regularly schedule performance assessments, monitor emerging web technologies, and remain adaptable in your optimization strategies.
Below is a comparison table highlighting popular website performance testing and monitoring tools, their primary features, and the main purposes each serves.
| Tool | Key Features | Main Purpose |
|---|---|---|
| Google PageSpeed Insights | Analyzes site speed, user experience metrics | Identifies optimization opportunities |
| Chrome DevTools | Network diagnostics, resource analytics | Pinpoints bottlenecks, tests critical metrics |
| GTmetrix | Detailed reports, waterfall charts | Monitors load speed and resource performance |
| WebPageTest | Simulates network/device conditions | Assesses page speed across environments |
| Apache JMeter | Simulates concurrent users, load testing | Evaluates site scalability and stress points |
| New Relic | Real-time monitoring, server response times | Ongoing site health and performance monitoring |
| Datadog | Performance dashboards, custom alerts | Tracks critical metrics, automates alerting |
| Google Analytics | Traffic analysis, user behavior insights | Monitors engagement and performance trends |
Step 6: Monitor Performance and Adjust Continuously
Continuous performance monitoring transforms website optimization from a one-time project into a dynamic, responsive strategy that adapts to evolving digital landscapes. This final step ensures your website remains agile, performant, and competitive by establishing a systematic approach to ongoing performance management.
Real-time monitoring tools like New Relic, Datadog, and Google Analytics provide comprehensive performance dashboards that track critical metrics in granular detail. These platforms offer more than simple performance snapshots; they deliver actionable insights into user behavior, server response times, and potential bottlenecks. Configure custom alerts that notify you immediately when key performance indicators deviate from established baselines, enabling rapid intervention and minimizing potential user experience disruptions.
Implement performance budgets as structured guidelines that define acceptable performance thresholds. These budgets establish clear, measurable boundaries for loading times, resource sizes, and rendering speeds. By setting specific targets for metrics like First Contentful Paint, Time to Interactive, and Total Blocking Time, you create a quantifiable framework for continuous improvement. Automated monitoring tools can help track these budgets, generating reports that highlight when and where performance standards are not being met.
Develop a structured review process that schedules regular performance audits. Monthly or quarterly comprehensive assessments allow you to analyze long-term performance trends, identify emerging optimization opportunities, and validate the effectiveness of previous improvements. This systematic approach transforms performance optimization from a reactive task into a proactive, strategic initiative that continuously enhances your digital presence.
According to performance engineering research from ScienceDirect, continuous performance interventions can yield significant improvements in web application efficiency, with some case studies demonstrating performance gains of up to 45% through consistent monitoring and targeted adjustments.
Evaluate the success of your continuous monitoring strategy by tracking these key indicators:
- Consistent achievement of performance budget targets
- Reduced incident response times
- Minimal performance degradation between audits
- Proactive identification of potential optimization opportunities
Remember that website performance optimization is an ongoing journey, not a destination. Stay curious, remain adaptable, and cultivate a mindset of continuous learning and improvement. Your commitment to systematic performance management will differentiate your digital presence in an increasingly competitive online ecosystem.
The checklist below helps verify the effectiveness of website optimization efforts by summarizing the key indicators to track during and after implementation.
| Verification Step | What to Check | Outcome Sought |
|---|---|---|
| Reduced page load time | Compare before-and-after load speed | Faster user experience |
| Resource transfer size | Monitor smaller file sizes, especially images | Lower bandwidth usage |
| HTTP request count | Ensure fewer, optimized requests | Efficient resource loading |
| Core Web Vitals improvement | Track LCP, FID, and CLS metrics | Higher search and user experience score |
| Server response time | Assess server processing delays | Stable, responsive performance |
| Performance under load | Test site with multiple concurrent users | Maintained speed under stress |
| Alert and monitoring setup | Confirm real-time alerts are active | Fast identification of issues |
Ready to Unlock Peak Website Performance and Grow Your Business?
If you found yourself overwhelmed by slow page loads, confusing resource bottlenecks, and the challenge of ongoing optimization, you are not alone. Many businesses struggle to master techniques like image compression, caching, and load testing for better website speed. Want to see how proven strategies and real-world solutions can accelerate your online success? Get expert tips, case studies, and action guides in our How to … section.

Let Solution4Guru step in as your dedicated digital partner. We offer tailored web development, optimization, and business consulting to transform your website into a high-performance asset that delights users and drives results. Do not wait until your competition outranks you. Visit Solution4Guru.com to book your free consultation today and take the first confident step toward online excellence. Explore our full suite of digital solutions designed for real business growth.
Frequently Asked Questions
How can I analyze my website’s current performance metrics?
You can analyze your website’s performance using tools like Google PageSpeed Insights, which provides a detailed report on loading times, interactivity, and visual stability. This will help you identify areas for optimization.
What are Core Web Vitals, and why are they important?
Core Web Vitals are metrics that gauge the user experience of a website. They include Largest Contentful Paint (LCP), First Input Delay (FID), and Cumulative Layout Shift (CLS). These metrics are important because they directly impact user satisfaction and search engine rankings.
What strategies can I use to optimize images for better website performance?
To optimize images, you can compress them using tools like TinyPNG, use modern formats like WebP, and implement responsive image strategies using the srcset attribute to serve appropriately sized images based on the user’s device.
How can I continuously monitor my website’s performance?
You can continuously monitor your website’s performance using real-time monitoring tools like New Relic and Google Analytics. Set up alerts for key performance indicators and regularly audit performance metrics to ensure your website remains optimized.