KPIs Every U.S. Project Manager Should Track

Project managers across the United States face a constant challenge: how do you know whether a project is truly on track? Deadlines can look fine on the surface while budgets quietly spiral out of control, or teams stay busy without actually moving the needle on outcomes. The answer lies in tracking the right Key Performance Indicators (KPIs). When project managers measure the metrics that matter most, they transform uncertainty into clarity and reactive firefighting into proactive leadership.
This article walks you through the essential KPIs every U.S. project manager should monitor, explains why each one matters, and shows how modern project management platforms — particularly Zoho Projects and Quickbase Project Management — make KPI tracking faster, smarter, and more actionable.
Table of contents
Quick Summary
| KPI Category | Key Metrics | Why It Matters |
|---|---|---|
| Schedule Performance | SPI, On-Time Delivery Rate | Reveals timeline health |
| Budget & Cost | CPI, Budget Variance, ROI | Controls financial outcomes |
| Quality | Defect Rate, Rework %, Customer Satisfaction | Ensures deliverable standards |
| Team Productivity | Velocity, Utilization Rate, Capacity | Optimizes human resources |
| Risk | Risk Exposure Score, Issues Resolved | Prevents project derailment |
| Stakeholder Satisfaction | NPS, Engagement Score | Aligns project to expectations |
How Do Zoho Projects and Quickbase Help U.S. Project Managers Track KPIs?
Before diving into individual KPIs, it is worth understanding how the right software transforms KPI tracking from a manual chore into an automated intelligence system.
Is Zoho Projects the Right Dashboard for Your KPI Tracking Needs?

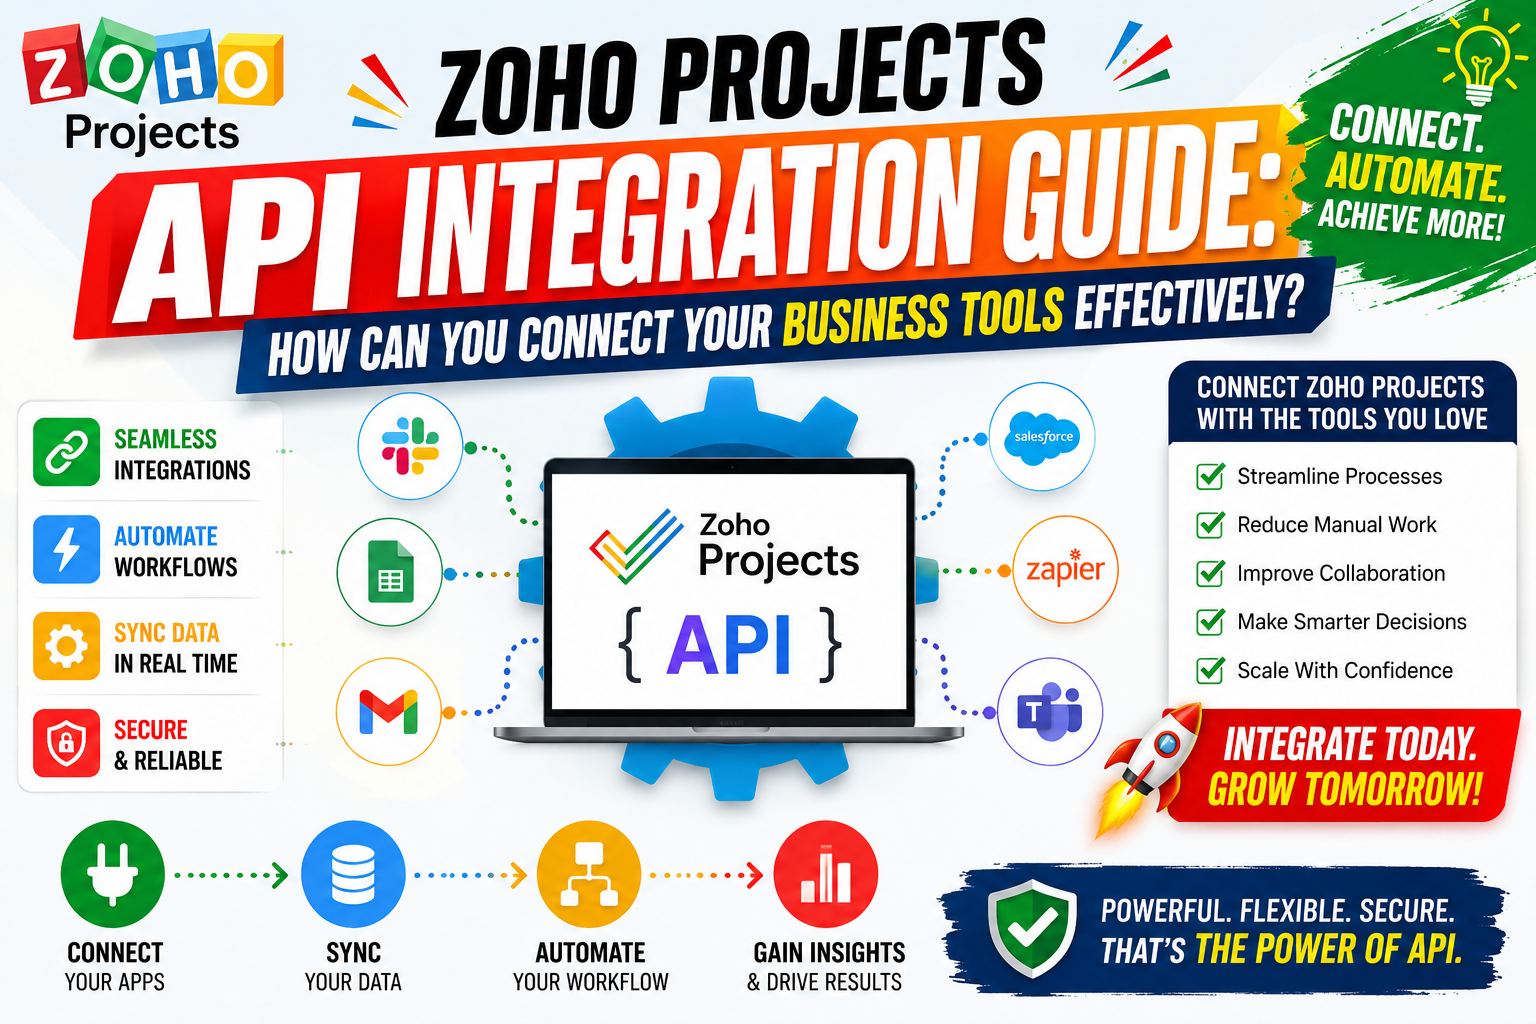
Zoho Projects is a cloud-based project management platform that delivers built-in KPI dashboards, Gantt charts, time-tracking, resource utilization views, and budget monitoring tools — all within a single interface. Project managers use it to visualize schedule variances, track milestones, log billable hours, and generate automated status reports without switching between tools.
Furthermore, Zoho Projects integrates with the broader Zoho ecosystem (CRM, Analytics, Finance), giving U.S. organizations a 360-degree view of project performance alongside business outcomes. You can explore it at Zoho Projects.
What Makes Quickbase a Powerful KPI Tracking Solution?

Quickbase Project Management takes a no-code, highly customizable approach. Rather than offering fixed dashboards, Quickbase lets project managers build their own KPI tracking apps tailored to their organization’s unique workflow. Teams configure custom fields, automated alerts, and real-time reports that surface exactly the metrics leadership needs.
Quickbase excels in environments where workflows differ significantly from department to department, or where project data must connect to operational systems like ERP or CRM platforms. Consequently, it suits mid-to-enterprise U.S. organizations that need flexibility alongside governance. Learn more at Quickbase Project Management.
Why Do KPIs Matter for U.S. Project Managers?
KPIs convert vague project goals into measurable targets. Without them, project managers rely on gut feeling and anecdotal updates — a recipe for surprises at the finish line. According to PMI’s Pulse of the Profession report, organizations that consistently track project performance KPIs complete 28% more projects on time and 24% more on budget compared to those that do not. That gap represents millions of dollars in cost avoidance and significantly better client satisfaction.
Moreover, U.S. regulatory environments — particularly in healthcare, construction, and government contracting — demand documented evidence of project performance. KPIs provide the audit trail that compliance requires. Therefore, building a disciplined KPI tracking habit is not just good practice; it is increasingly a professional necessity.
What Are the Most Critical Schedule KPIs Every Project Manager Must Monitor?
How Does the Schedule Performance Index Reveal Timeline Risk?
The Schedule Performance Index (SPI) is one of the most powerful indicators in Earned Value Management (EVM). Project managers calculate it by dividing Earned Value (EV) by Planned Value (PV). An SPI above 1.0 means the project runs ahead of schedule, while a reading below 1.0 signals a delay.
Zoho Projects automates SPI calculation within its Earned Value module, so project managers always see the current SPI on their dashboard without manually crunching numbers. This real-time visibility allows teams to intervene early — adjusting resources, compressing schedules, or re-sequencing tasks — before a small delay snowballs into a critical path crisis.
| SPI Value | Interpretation | Recommended Action |
|---|---|---|
| Above 1.0 | Ahead of schedule | Maintain pace, reallocate buffer |
| Exactly 1.0 | On schedule | Monitor closely |
| 0.8 – 0.99 | Slightly behind | Review critical path tasks |
| Below 0.8 | Significantly behind | Escalate, rebaseline if needed |
What Does On-Time Delivery Rate Tell You About Your Team?
On-Time Delivery Rate measures the percentage of milestones, tasks, or project phases that teams complete on or before the agreed date. U.S. project managers track this KPI both at the task level and the project level to understand where delays originate.
A consistently low On-Time Delivery Rate often points to unrealistic planning, resource bottlenecks, or poor dependency management rather than individual performance issues. Consequently, investigating the root cause of this metric leads to systemic improvements — better estimation practices, clearer task ownership, and more realistic buffer allocation — that boost team performance across all future projects.
How Do Budget and Cost KPIs Prevent Financial Overruns?

Why Should Project Managers Track the Cost Performance Index Closely?
The Cost Performance Index (CPI) mirrors the SPI but measures financial efficiency rather than time. Project managers calculate it by dividing Earned Value by Actual Cost (AC). A CPI above 1.0 confirms that the project delivers more value per dollar spent than planned, while a CPI below 1.0 indicates cost overruns.
Zoho Projects‘ budget tracking module lets project managers set baseline budgets, log actual expenses, and automatically derive CPI alongside a visual budget burn-down chart. This combination gives executives immediate confidence that the team manages money responsibly and flags issues weeks before the next formal project review.
How Does Budget Variance Expose Hidden Cost Risks?
Budget Variance (BV) measures the absolute dollar difference between planned spending and actual spending at any given point in the project. While CPI expresses performance as a ratio, Budget Variance gives stakeholders the raw number — making it easier to communicate financial impact to non-technical sponsors.
Additionally, tracking Budget Variance alongside Estimate at Completion (EAC) enables project managers to forecast the final cost with high confidence. EAC projects the total spend based on current performance trends, so if a project is running 15% over budget midway through, the EAC reveals what that trajectory means by project close — and prompts corrective action before it is too late.
| Cost KPI | Formula | Target | Tool in Zoho Projects |
|---|---|---|---|
| CPI | EV / AC | >= 1.0 | Earned Value dashboard |
| Budget Variance | Planned Cost – Actual Cost | Positive or zero | Budget tracking module |
| EAC | Budget / CPI | Close to original budget | Forecast reports |
| ROI | (Benefits – Cost) / Cost x 100 | Positive %, higher = better | Portfolio analytics |
Which Quality KPIs Should Project Managers Include in Their Tracking Framework?
How Does Defect Rate Reflect the True Health of Your Deliverables?
Defect Rate calculates the percentage of deliverables — whether software features, construction elements, or reports — that fail to meet quality standards upon first review. A high Defect Rate signals process problems: unclear requirements, insufficient testing, or inadequate team training. Tracking it early in a project rather than only at acceptance testing allows managers to course-correct before quality issues compound.
In software development projects, for instance, a Defect Rate above 5% per sprint typically indicates requirements ambiguity. In manufacturing or construction projects, a high Defect Rate can trigger costly rework, warranty claims, or regulatory penalties. Therefore, project managers across industries consistently place Defect Rate among their top five KPIs.
Why Does Customer Satisfaction Score Matter as a Project KPI?
Many project managers focus exclusively on delivery metrics — did we finish on time, on budget, and within scope? Yet customer or stakeholder satisfaction captures a dimension that quantitative KPIs miss: whether the delivered product actually meets the real-world needs of the people who use it.
U.S. organizations increasingly collect Customer Satisfaction Scores (CSAT) or Net Promoter Scores (NPS) at key project milestones rather than only at closeout. Gathering this feedback mid-project enables teams to pivot if a stakeholder’s needs have shifted, rather than delivering a technically compliant but practically irrelevant outcome. Zoho Projects integrates with Zoho Survey, making it straightforward to distribute satisfaction surveys linked directly to project milestones.
How Can Project Managers Track Team Productivity KPIs Effectively?
What Does Team Velocity Reveal About Sprint and Project Capacity?
Velocity, widely used in Agile project management, measures the amount of work a team completes per sprint or iteration — typically expressed in story points or tasks. Tracking velocity over multiple sprints establishes a reliable baseline that enables accurate forecasting. If a team consistently completes 40 story points per sprint, a project manager can plan a 400-point backlog knowing it will take approximately 10 sprints.
Zoho Projects includes a Sprint Board view with automatic velocity tracking, displaying velocity trends across past sprints so project managers can spot whether a team accelerates, maintains pace, or slows down over time. A declining velocity trend often signals team burnout, growing technical debt, or unclear requirements — each of which warrants prompt investigation.
Why Is Resource Utilization Rate a Game-Changing Productivity Metric?
Resource Utilization Rate measures the percentage of available working hours that team members actively spend on productive project work. The ideal utilization rate in most U.S. project environments sits between 70% and 85%. Below this range, the team is underused. Above it — particularly above 90% — the team faces burnout risk and loses capacity to handle unexpected issues.
Zoho Projects provides a Resource Utilization view that shows each team member’s current allocation as a percentage, color-coded for at-a-glance interpretation. Project managers use this view to redistribute workloads proactively — moving tasks from overloaded team members to those with spare capacity — before utilization imbalances create performance bottlenecks.
| Productivity KPI | Definition | Healthy Range | Red Flag |
|---|---|---|---|
| Velocity | Work completed per sprint | Stable or growing | Declining 2+ sprints |
| Resource Utilization | Active hours / available hours | 70% – 85% | Above 90% or below 60% |
| Task Completion Rate | Tasks done / tasks planned | > 90% | Below 75% |
| Cycle Time | Time from start to completion per task | Decreasing trend | Increasing trend |
How Should Project Managers Approach Risk KPI Tracking?

What Is Risk Exposure Score and How Do Teams Calculate It?
Risk Exposure Score quantifies the aggregate impact of all identified project risks, calculated as the sum of (Probability x Impact) across the risk register. Unlike a simple count of open risks, this score weights risks by their potential damage, giving project managers a single number that reflects the true risk burden at any given moment.
Tracking Risk Exposure Score weekly enables project managers to observe whether their risk mitigation actions actually reduce exposure over time. A score that rises steadily despite mitigation efforts signals that new risks are entering the project faster than the team resolves existing ones — a pattern that often precedes scope creep or schedule collapse.
Why Do Issue Resolution Rate and Escalation Rate Matter?
Issue Resolution Rate measures the percentage of logged project issues that the team resolves within the target timeframe. A low resolution rate creates a growing backlog of unresolved blockers that drag down team velocity and erode stakeholder confidence. Escalation Rate, meanwhile, tracks what percentage of issues require senior management intervention — a high rate suggests the team lacks either the authority or the capability to solve problems at the appropriate level.
Quickbase Project Management excels at issue tracking because its no-code workflow builder lets organizations design custom escalation paths. When an issue remains unresolved beyond a threshold, Quickbase automatically notifies the relevant senior stakeholder — eliminating the manual follow-up work that consumes so much of a project manager’s time.
How Do Stakeholder KPIs Complete the Full Picture of Project Performance?
Why Is Stakeholder Engagement Score an Underused Project KPI?
Stakeholder Engagement Score measures how actively key project stakeholders participate in reviews, provide feedback, and respond to requests. Low engagement from critical decision-makers is one of the top causes of project failure in U.S. organizations, yet many project managers do not formally track it as a KPI.
Project managers can measure engagement through meeting attendance rates, review response times, and survey participation rates — then aggregate these into a composite score. A declining Stakeholder Engagement Score early in a project often predicts scope disputes and budget re-approvals later, making it a remarkably predictive leading indicator of project health.
How Does Zoho Projects Unify All Your Project KPIs in One Place?
Managing multiple KPIs manually across spreadsheets is both time-consuming and error-prone. Zoho Projects solves this problem by centralizing schedule, budget, quality, team, and risk KPIs within a single cloud-based platform. Project managers configure customizable dashboards that surface the specific metrics each stakeholder needs — executives see portfolio-level summaries while team leads monitor task-level details.
Furthermore, Zoho Projects automates data collection through time-logging, milestone tracking, and integration with third-party tools via Zapier and native APIs. This automation means KPI data updates in real time as team members complete tasks, log hours, and close issues — eliminating the weekend data-gathering ritual that consumes so many project managers’ time.
Zoho Projects also generates automated project health reports, comparing current KPI values against baselines and flagging exceptions that require attention. Rather than reviewing every metric manually, project managers focus their attention where Zoho’s exception-based alerts direct them — making their oversight role significantly more efficient.
What Are the Key Takeaways for U.S. Project Managers Tracking KPIs?
Effective KPI tracking is not about measuring everything — it is about measuring the right things consistently and acting on what the data reveals. The most successful U.S. project managers build a balanced KPI framework that covers schedule performance, cost management, quality assurance, team productivity, risk exposure, and stakeholder satisfaction simultaneously.
Zoho Projects stands out as a comprehensive solution for project managers who want a unified KPI dashboard without the complexity of building custom tools. Its built-in Earned Value tracking, resource utilization views, Sprint boards, and automated reports give teams the visibility they need to manage performance proactively rather than reactively. From small business projects to enterprise-level initiatives, Zoho Projects scales with the organization’s needs while keeping KPI data accessible and actionable.
Ultimately, the project managers who achieve the best results treat KPIs not as reporting obligations but as management tools. They review them frequently, share them transparently with stakeholders, and use the insights to make faster, better-informed decisions. That discipline — supported by capable platforms like Zoho Projects — separates consistently successful project managers from those who perpetually react to surprises.
Frequently Asked Questions
Most project management experts recommend tracking between 8 and 12 KPIs at any given time. Tracking fewer than five creates blind spots — you may miss early warning signs of budget overruns or team burnout. Tracking more than 15 creates information overload, diluting attention from the metrics that matter most. The ideal approach groups KPIs by category (schedule, cost, quality, people, risk, stakeholders) and selects one to three indicators per category, ensuring comprehensive coverage without drowning in data. Zoho Projects helps project managers find this balance by offering pre-built dashboard templates organized by KPI category. Teams start with the recommended set, then customize based on what their stakeholders care about most and what project type demands.
Lagging indicators measure outcomes that have already occurred — for example, final project cost or customer satisfaction score at project close. These metrics tell you how well the project performed in retrospect. Leading indicators, by contrast, predict future outcomes based on current activity — examples include resource utilization rate, risk exposure score, and stakeholder engagement score. These give project managers a chance to intervene before a problem becomes a statistic.
The most effective KPI frameworks balance both types. Lagging indicators confirm whether strategy works. Leading indicators give project managers the time to adjust course while a difference is still possible. Platforms like Zoho Projects and Quickbase surface both types simultaneously, ensuring that project managers always see both what has happened and what is likely to happen next.
Why Should U.S. Project Managers Partner With Solution for Guru?
Implementing a KPI tracking framework and configuring project management software to support it requires expertise that many in-house teams do not have. That is exactly where partnering with a specialized consultancy makes the difference between a rushed rollout and a system that genuinely transforms performance.
Solution for Guru provides U.S. project managers and organizations with expert-level support for implementing KPI frameworks, configuring Zoho Projects and other project management platforms, and training teams to use data-driven decision-making in their daily workflow. Their consultants bring deep hands-on experience with Zoho’s full suite, ensuring that dashboards, reports, and automations align precisely with your organization’s KPI priorities.
Additionally, Solution for Guru offers ongoing optimization services — reviewing KPI frameworks as projects evolve, identifying gaps in tracking coverage, and ensuring that the metrics you track remain aligned with organizational strategy. Their team combines project management methodology expertise with technical platform knowledge, making them uniquely positioned to deliver both strategic clarity and practical implementation support.
Key benefits of working with Solution for Guru:
- Expert configuration of Zoho Projects dashboards aligned to your specific KPI framework
- Custom KPI template design tailored to your industry and project type
- Team training programs that build sustainable internal KPI tracking habits
- Ongoing performance reviews to refine and optimize your metrics over time
- Integration support connecting Zoho Projects to your existing business systems
Recommended:
- How Can You Automate Task Assignments and Notifications in Project Management?
- How Does Time Tracking and Billing Automation Transform Project Management?
- Resource Allocation and Capacity Planning in Project Management: How Do You Build Teams That Consistently Deliver?
- How Project Management Improves ROI for U.S. Businesses
- Most In-Demand Project Management Skills in the U.S. Job Market
- Zoho Projects Implementation for Software Development Teams
- Zoho Projects + Zoho CRM: Managing Sales-to-Project Workflows
- Using Zoho Projects for Agile Development
- Zoho Projects Architecture and Workflow Model
- What Essential Skills Do Successful Project Managers Need to Master?
- How Can AI Transform Project Management for Modern Teams?
- Project Management Platforms
- Project Management Certification
- Project Management Jobs