Measuring Digital Marketing ROI: A 2026 Guide

TL;DR:
- Accurate digital marketing ROI calculation requires a fully loaded cost model including all expenses and appropriate attribution of revenue.
- Key metrics like CAC, CLV, and MER, along with consistent attribution models and proper timeframes, enhance performance evaluation accuracy.
Digital marketing ROI is defined as the net revenue attributed to a marketing campaign divided by total campaign costs, expressed as a percentage. The standard formula is: ((Revenue Attributed to Marketing − Total Marketing Cost) / Total Marketing Cost) × 100. Measuring digital marketing ROI accurately requires including every cost, from agency fees and software subscriptions to internal salaries and creative production. Without a fully loaded cost model, the number you report is not ROI. It is a flattering fiction that leads to poor budget decisions.
What costs and revenues should you include when measuring digital marketing ROI?
True ROI calculations require a fully loaded cost model. That means every dollar spent to produce, distribute, and manage a campaign must enter the denominator before you calculate anything.
The costs that most teams undercount include:
- Agency and freelancer fees: Retainers, project fees, and performance bonuses paid to external partners.
- Software and platform costs: Ad platform spend, marketing automation licenses, analytics tools, and CRM subscriptions. Platforms like Valiz help teams consolidate these line items into a single cost view.
- Creative and production: Video production, copywriting, design, and photography, whether produced in-house or outsourced.
- Internal salaries: The portion of staff time dedicated to the campaign. A campaign manager spending 40% of their time on one initiative should contribute 40% of their salary to that campaign’s cost.
- Overhead allocation: Server costs, office space, and tools shared across campaigns, prorated by usage.
On the revenue side, the attribution method determines what you count. Direct e-commerce sales are the simplest case. For lead generation, assign each lead a value based on your historical close rate multiplied by average deal size. For subscription businesses, use Customer Lifetime Value (CLV) rather than first-purchase revenue. This prevents you from declaring a campaign unprofitable simply because the payback period extends beyond the reporting window.
Integrating your analytics platform with your CRM and accounting system is the only way to connect campaign spend to actual closed revenue. Without that connection, you are estimating, not measuring.

Pro Tip: Audit your cost model once per quarter. Software subscriptions and agency scope changes are the most common sources of cost underreporting.
Which metrics and models complement digital marketing ROI measurement?
Marketing ROI is not a singular number but part of a suite of metrics that together reveal business health. Three metrics belong in every marketing dashboard alongside ROI.
Customer Acquisition Cost (CAC) measures the total cost to acquire one new customer. It tells you whether your growth is sustainable. Customer Lifetime Value (CLV) measures the total revenue a customer generates over their relationship with your business. A CLV-to-CAC ratio above 3:1 is the standard benchmark for healthy unit economics. Return on Ad Spend (ROAS) measures revenue generated per dollar of paid media spend. ROAS is channel-specific and does not include non-media costs, so it complements ROI rather than replacing it.
Attribution models determine which touchpoints receive credit for a conversion. The four most common models are:
- Last-touch attribution: All credit goes to the final touchpoint before conversion. Simple to implement, but systematically undervalues upper-funnel channels like content and SEO.
- Multi-touch attribution (linear or position-based): Credit is distributed across all touchpoints in the customer journey. More accurate, but requires clean cross-channel tracking data.
- Marketing Mix Modeling (MMM): A statistical approach that uses historical spend and revenue data to estimate the contribution of each channel. Works well for large datasets and long time horizons.
- Incrementality testing: Controlled experiments that measure the lift in conversions caused by a specific campaign. The most rigorous method, but requires sufficient traffic volume and careful experimental design.
Vanity metrics like likes, followers, and impressions do not correlate directly with revenue and should be excluded from ROI analysis. Only CAC, CLV, and conversion rates by channel reliably indicate campaign profitability.
The practical rule is to choose the most workable attribution model for your data environment and apply it consistently across reporting periods. Always document the model’s limitations so stakeholders understand what the numbers do and do not capture.
How do you set up a digital marketing ROI measurement system?
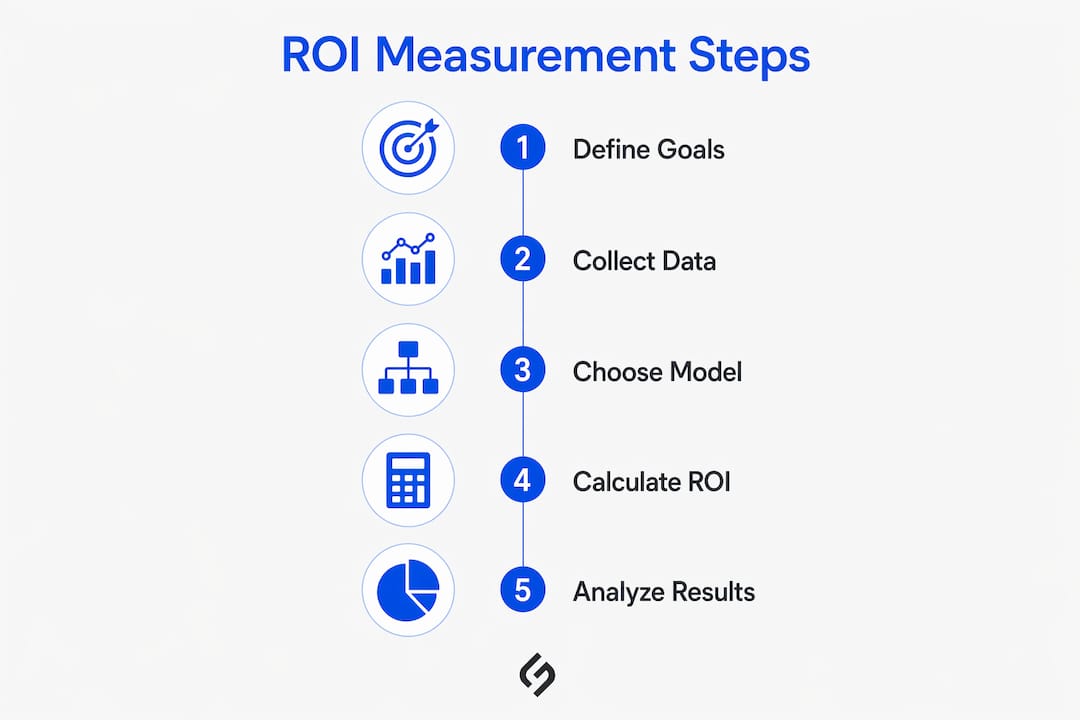
Building a reliable measurement system requires five sequential steps. Skipping any one of them produces gaps that compound over time.
Define monetary outcomes. Map every conversion event to a dollar value. For e-commerce, this is straightforward. For B2B lead generation, assign a value using average deal size multiplied by close rate. For content marketing, assign a value to email subscribers or trial signups based on downstream conversion data.
Connect your data sources. Link your ad platforms, website analytics, CRM, and accounting system. The goal is a single data pipeline where a click on a paid ad can be traced to a closed deal in your CRM and a recorded payment in your accounting system. Without this connection, your ROI calculation relies on estimates at every stage.
Calculate ROI, ROAS, CAC, and CLV-aware ROI. Run these calculations at the campaign level, the channel level, and the portfolio level. Channel-level data tells you where to reallocate budget. Portfolio-level data tells you whether your overall marketing investment is generating acceptable returns.
Run controlled experiments. Geo splits and holdout groups are the most reliable way to measure marginal ROI. A holdout test withholds a campaign from a matched control group and measures the revenue difference. Statistical validity requires a 95% confidence threshold before drawing conclusions.
Establish a reporting cadence. Weekly dashboards for paid media, monthly reviews for content and SEO, and quarterly reviews for the full marketing portfolio. Reporting frequency should match the channel’s feedback loop.
Setting up a full ROI measurement system typically takes 3–8 hours per campaign for straightforward setups. Enterprise environments with multiple data sources and complex attribution requirements can require 1–2 days of configuration per campaign cycle.
Pro Tip: Build your measurement system before the campaign launches, not after. Retroactive attribution is always less accurate than prospective tracking.
The table below shows how measurement effort scales with campaign complexity.
| Campaign type | Estimated setup time | Primary attribution method |
|---|---|---|
| Single-channel paid media | 3–4 hours | Last-touch or ROAS |
| Multi-channel lead generation | 6–8 hours | Multi-touch or MMM |
| Enterprise portfolio | 1–2 days | MMM + incrementality testing |
What are the common pitfalls when evaluating marketing performance?
Attribution gaps are the most persistent problem in digital marketing measurement. Standard tracking tools fail to capture approximately 64% of B2B buying behavior that occurs through dark social channels, including private messaging apps, email forwards, and offline conversations. That figure means the majority of B2B influence is invisible to standard analytics. The practical response is to supplement click-based attribution with survey data, CRM notes, and self-reported attribution fields on lead forms.
Reporting window mismatch is the second major pitfall. A 30-day reporting window applied to a channel with a 90–180 day B2B sales cycle will always make that channel look unprofitable. SEO and content marketing often take 6–12 months to produce measurable revenue impact. Measuring them on a monthly basis systematically undervalues their contribution and leads to premature budget cuts.
Channels like SEO and content marketing are not slow. They are measured on the wrong clock. Applying a 30-day reporting window to a 6-month asset maturity curve is not measurement. It is a category error that destroys long-term marketing investment.
Three additional pitfalls to avoid:
- Inconsistent model switching: Changing attribution models between reporting periods makes trend analysis impossible. Pick a model and document it.
- Reporting without stated assumptions: Every ROI report should include a footnote listing the attribution model used, the cost inclusions, and the revenue definition. Stakeholders cannot evaluate a number without knowing how it was built.
- Ignoring system-level metrics: The Marketing Efficiency Ratio (MER), calculated as Total Revenue divided by Total Marketing Spend, provides a portfolio-level view that is immune to attribution disputes. Use MER alongside channel-level ROI to catch cases where channel metrics look strong but overall efficiency is declining.
The role of data in marketing strategy extends beyond reporting. Clean, integrated data is what separates teams that react to results from teams that predict them.
Key Takeaways
Accurate digital marketing ROI measurement requires a fully loaded cost model, consistent attribution, and reporting windows matched to each channel’s actual sales cycle.
| Point | Details |
|---|---|
| Use a fully loaded cost model | Include agency fees, software, salaries, and production costs in every ROI calculation. |
| Match reporting windows to sales cycles | B2B channels need 90–180 day windows; applying 30-day snapshots systematically undervalues them. |
| Supplement ROI with CAC and CLV | These three metrics together reveal both short-term efficiency and long-term profitability. |
| Choose one attribution model and keep it | Switching models between periods makes trend analysis unreliable and misleads stakeholders. |
| Use MER as a portfolio check | Marketing Efficiency Ratio catches cases where channel metrics look strong but overall returns are falling. |
What I have learned from years of measuring marketing returns
The most common mistake I see is treating ROI as a single, clean number that arrives automatically from a dashboard. It never does. Every ROI figure is the product of decisions: which costs to include, which attribution model to apply, which revenue events to count. Teams that do not make those decisions explicitly end up with numbers that are technically correct and practically useless.
The second lesson is that combining ROI with CAC and CLV changes how you read results entirely. A campaign with a 150% ROI looks excellent in isolation. If that campaign’s CAC is three times your average CLV, you are acquiring customers at a loss and the ROI figure is hiding it. The metrics only tell the truth when you read them together.
My strongest recommendation for teams building measurement systems for the first time: resist the urge to chase perfect attribution. Perfect attribution does not exist. What exists is a consistent, documented model that your team applies the same way every quarter. Consistency produces trends. Trends produce decisions. That is the actual goal.
Patience matters most for channels like SEO and content. These assets compound over time. A piece of content that generates minimal traffic in month one may drive significant qualified leads by month nine. Measuring it at month one and cutting the budget is one of the most expensive mistakes a marketing team can make.
How Solution For guru supports your marketing ROI measurement
Measuring marketing performance accurately depends on having the right data infrastructure in place. Solution4guru works with marketing teams and business owners to build integrated systems that connect ad platforms, CRM data, and revenue reporting into a single, coherent view.

Whether you are building your first digital marketing strategy or refining an existing measurement framework, Solution4guru provides the technical and strategic support to make your data work. From analytics integration to campaign tracking architecture, the team helps you move from reporting vanity metrics to tracking revenue outcomes. Explore the full range of digital marketing channels and data strategy resources on Solution4guru to find the right starting point for your business.
FAQ
What is the formula for digital marketing ROI?
Digital marketing ROI is calculated as ((Revenue Attributed to Marketing − Total Marketing Cost) / Total Marketing Cost) × 100. Total marketing cost must include agency fees, software, creative production, and internal salaries for an accurate result.
What is the difference between ROI and ROAS?
ROI measures net return across all marketing costs, while ROAS measures revenue generated per dollar of paid media spend only. ROAS is a channel-level metric; ROI is a business-level metric.
How long should a digital marketing ROI measurement window be?
The window should match the channel’s sales cycle. Paid search may warrant a 30-day window, while B2B content and SEO require 90–180 days or longer to reflect actual revenue impact accurately.
What is Marketing Efficiency Ratio and why does it matter?
Marketing Efficiency Ratio (MER) equals Total Revenue divided by Total Marketing Spend. It provides a portfolio-level view of marketing performance that is not distorted by attribution model choices.
Why do vanity metrics undermine ROI analysis?
Metrics like likes, impressions, and follower counts do not connect to revenue. Relying on them in ROI analysis produces reports that look positive while actual campaign profitability remains unknown.