A/B Testing Explained: How to Run Your First Experiment

A/B testing is a randomized controlled experiment that splits users into two groups, shows each group a different version of a page, email, or feature, and uses statistical analysis to determine which version performs better. The industry term is “split testing” or “bucket testing,” though A/B testing is the phrase most practitioners use. Use it when you have a measurable outcome, enough traffic to detect a meaningful change, and a specific hypothesis about what to improve.
The core components every practitioner needs to recognize:
- Control (A): The existing version, unchanged.
- Variant (B): The modified version with one change applied.
- Hypothesis: A written prediction stating what change you are making, why, and what metric you expect to move.
- Randomization: Users are assigned to groups by a deterministic algorithm, not manually, so the groups are statistically comparable.
- Primary metric: The single number that determines the winner (e.g., checkout conversion rate).
- Statistical significance: The threshold at which observed differences are unlikely to be due to chance alone.
Key Takeaways
A/B testing produces reliable results only when the hypothesis is written before launch, the sample size is pre-calculated, and the test runs to its planned endpoint without early stopping.
| Point | Details |
|---|---|
| Define hypothesis first | Write a structured prediction before any code is written; a weak hypothesis produces uninterpretable results. |
| Pre-calculate sample size | Use baseline conversion rate, MDE, alpha, and power as inputs; underpowered tests cannot be trusted. |
| Avoid peeking | Stopping a test early after a promising result inflates false-positive rates and produces unreliable winners. |
| Track guardrail metrics | A primary metric win that harms a downstream metric is not a real business improvement. |
| Solution4guru for implementation | Solution4guru provides analytics instrumentation, variant deployment, and UX implementation to support reliable experimentation. |
Table of Contents
- What does A/B testing mean? Core terms you need to know
- Why run A/B tests? The concrete business case
- When should you use A/B testing, and when should you choose something else?
- How do you run an A/B test from start to finish?
- How do p-values, confidence, and statistical power actually work?
- Which metrics should you track in an A/B test?
- What are good A/B test ideas and hypothesis templates?
- What are the best practices and biggest pitfalls in A/B testing?
- Which A/B testing tools should you use?
- How do teams integrate A/B testing into their workflow?
- What should you do when a test returns no clear winner?
- Expert note: choosing the right statistical test and reducing variance
- Why small tests beat grand experiments every time
- How Solution4guru helps you implement and act on A/B test results
- Sources
- FAQ
What does A/B testing mean? Core terms you need to know
A/B testing is a randomized experiment comparing variants with statistical hypothesis testing. Before running one, every team member involved should speak the same vocabulary.
Control and variant. The control is the baseline version currently in production. The variant, sometimes called the challenger, is the version with a single change. Testing more than one change at once makes it impossible to attribute the result to a specific modification.
Hypothesis. A structured statement in the form: “Changing X to Y will increase metric Z by at least N% because [behavioral reason].” A weak hypothesis produces an uninterpretable result even when the test is technically valid.
Primary metric and guardrail metrics. The primary metric is the one number the test is designed to move. Guardrail metrics are secondary measures you monitor to catch negative side effects. For example, a test designed to increase add-to-cart rate should also watch checkout completion rate to confirm the change does not hurt downstream behavior.
Minimum Detectable Effect (MDE). The smallest improvement worth detecting. A smaller MDE requires a larger sample. Setting MDE too small on a low-traffic site produces tests that take months to conclude.
Statistical power. The probability that a test will detect a real effect when one exists.
P-value and confidence level. The p-value measures the probability of observing the data if there were no true difference.
Additional terms worth knowing:
- A/A test: Both groups see the same version. Used to verify that the testing infrastructure assigns users correctly and that the false-positive rate matches expectations.
- Split URL test: Two entirely different page URLs are tested rather than on-page element changes. Useful for radical layout comparisons.
- Multivariate test (MVT): Tests multiple elements simultaneously to find the best combination. Requires substantially more traffic than a standard A/B test.
Pro Tip: Run an A/A test before your first real experiment. If it returns a statistically significant result, your assignment or tracking is broken.
Why run A/B tests? The concrete business case
A/B testing shifts design debates from opinion to evidence and is most effective for continuous, incremental improvements rather than wholesale redesigns. That distinction matters in practice because it defines where experimentation fits in a product roadmap.
The business benefits are direct:
- Data-driven decisions. Teams replace subjective debates about button color or headline copy with measured outcomes tied to real user behavior.
- Reduced risk. A change is validated on a fraction of traffic before full rollout, limiting exposure if the variant underperforms.
- Measurable ROI. Because the primary metric is defined before launch, the revenue or conversion impact of a winning variant is calculable.
- Incremental UX improvement. Small, frequent wins compound. Small incremental improvements in checkout conversion rate, repeated regularly, produce substantial annual revenue growth.
Common metrics that A/B tests move: conversion rate, click-through rate (CTR), revenue per visitor (RPV), average order value (AOV), session duration, and retention rate. The right metric depends on the objective. A signup funnel test watches form completion rate. A paid acquisition test watches RPV or cost per acquisition.
Organizations that treat experimentation as a continuous process rather than a one-off project build compounding knowledge about their users. Each documented test result, including null results, narrows the hypothesis space for future experiments and reduces wasted development effort.
When should you use A/B testing, and when should you choose something else?
A/B testing is the right tool when three conditions are met: you have a specific, measurable outcome; you have enough traffic to reach statistical significance in a reasonable timeframe; and you are comparing two defined approaches rather than exploring an open-ended question.
- Use A/B testing when you want to validate a specific change to an existing experience, such as a new CTA copy, a revised pricing layout, or a reordered onboarding step.
- Use qualitative research (user interviews, usability testing, session recordings) when you do not yet know what to change. Qualitative methods surface the “why” behind behavior; A/B tests confirm whether a proposed fix works.
- Use prototyping or concept testing for radical redesigns. Testing an entirely new page structure against the current one often produces inconclusive results because too many variables change at once.
- Use multivariate testing when you need to find the best combination of multiple elements and have the traffic to support it. MVT requires traffic volumes several times larger than a standard two-variant test.
- Use split URL testing when comparing two structurally different pages that cannot be served from the same URL.
Sample size depends on baseline conversion rate, MDE, alpha, and power; small MDEs require much larger samples and may be impractical on low-traffic sites. A site receiving 500 sessions per day testing a 2% baseline conversion rate with a 10% relative MDE will need weeks to reach significance. If that timeline is impractical, raise the MDE threshold, focus on higher-traffic pages, or use qualitative methods to build a stronger hypothesis before testing.
Pro Tip: Before committing to a test, run a sample-size calculation using your actual baseline conversion rate and your realistic MDE. If the required runtime exceeds four to six weeks, reconsider the test design.
How do you run an A/B test from start to finish?
A disciplined A/B test requires a written hypothesis, a pre-calculated sample size, stable variant assignment, proper instrumentation, and a commitment not to read results before the planned endpoint. The following runbook covers each step.
- Write a structured hypothesis. State the change, the expected direction, the primary metric, and the behavioral reason. Example: “Changing the CTA from ‘Submit’ to ‘Get My Free Report’ will increase form submissions by at least 15% because it communicates specific value.”
- Select one primary metric. Identify guardrail metrics before launch. Do not change the primary metric after the test starts.
- Calculate required sample size. Use a sample-size calculator (Evan Miller’s tool or a built-in platform calculator). Inputs: baseline conversion rate, MDE, alpha (typically 0.05), and power (typically 0.80).
- Set up deterministic bucketing. Assign users to variants using a stable identifier (user ID or cookie) so the same user always sees the same variant. Inconsistent assignment inflates variance and produces unreliable results.
- Instrument and verify tracking. Confirm that conversion events fire correctly for both variants before launch. Run a pre-launch QA check.
- Launch and monitor for SRM. A sample-ratio mismatch (SRM) occurs when the observed split between groups differs from the intended split. Check for SRM within the first 24–48 hours. An SRM invalidates the test.
- Run to the pre-planned endpoint. Do not stop early because results look promising. Peeking inflates false-positive rates significantly.
- Analyze results for statistical and practical significance. A statistically significant result with a negligible practical effect size may not justify a rollout.
- Document and decide. Record the hypothesis, result, confidence level, and decision in a shared test registry. Ship the winner, iterate on a loss, or retest an inconclusive result.
Sample size matters more than any other single decision. Underpowered tests and early stopping are the primary causes of unreliable results in conversion optimization programs.
How do p-values, confidence, and statistical power actually work?
Statistics are the mechanism that separates a real effect from random noise. Understanding three concepts is enough for most practitioners.
P-value and confidence level. The p-value is the probability of observing the measured difference (or a larger one) if the two variants were actually identical. The confidence level is the complement: 1 minus the p-value.
Statistical power. Power is the probability of detecting a real effect when one exists.
The relationship is nonlinear: halving the MDE roughly quadruples the required sample size.
Industry practitioners commonly use Welch’s t-test for comparing means because it makes fewer assumptions about equal variance than alternative tests. For binary conversion metrics (converted vs. not converted), a two-proportion z-test or chi-squared test is also appropriate. Welch’s t-test is preferred when comparing continuous metrics like revenue per visitor, where variance between groups often differs.
Pro Tip: Set alpha and power before launch, not after. Adjusting these thresholds after seeing results is a form of p-hacking that inflates false-positive rates.
Which metrics should you track in an A/B test?
A/B tests should use guardrail metrics alongside the primary metric to avoid misleading wins. Choosing the wrong primary metric is one of the most common ways a technically valid test produces a misleading business decision.
Common metrics by use case:
- Conversion rate: The percentage of users who complete a target action. The most common primary metric for landing pages and signup funnels.
- Click-through rate (CTR): Useful for email subject line tests and ad creative tests. Watch downstream conversion rate as a guardrail.
- Revenue per visitor (RPV): Captures both conversion rate and order value in one metric. Preferred for e-commerce tests where a change might increase conversions but reduce AOV.
- Average order value (AOV): Useful when testing upsell or cross-sell elements.
- Retention rate: Relevant for onboarding flow tests and feature adoption experiments.
- Engagement metrics: Session depth, scroll depth, and time on page are useful guardrails but rarely appropriate as primary metrics because they do not directly reflect business value.
Selecting a primary metric requires matching it to the business objective. A test on a free-trial signup page should use trial signup rate, not page views. A test on a checkout flow should use purchase completion rate, not add-to-cart rate, unless the test is specifically targeting the cart step.
For conversion rate optimization, pairing a primary metric with one or two guardrails is standard practice. A test that increases form submissions but reduces downstream paid conversions has not produced a real win.
What are good A/B test ideas and hypothesis templates?
The best test ideas come from user research, analytics data, and behavioral observations, not from guessing. The following examples span common contexts.
Web page tests:
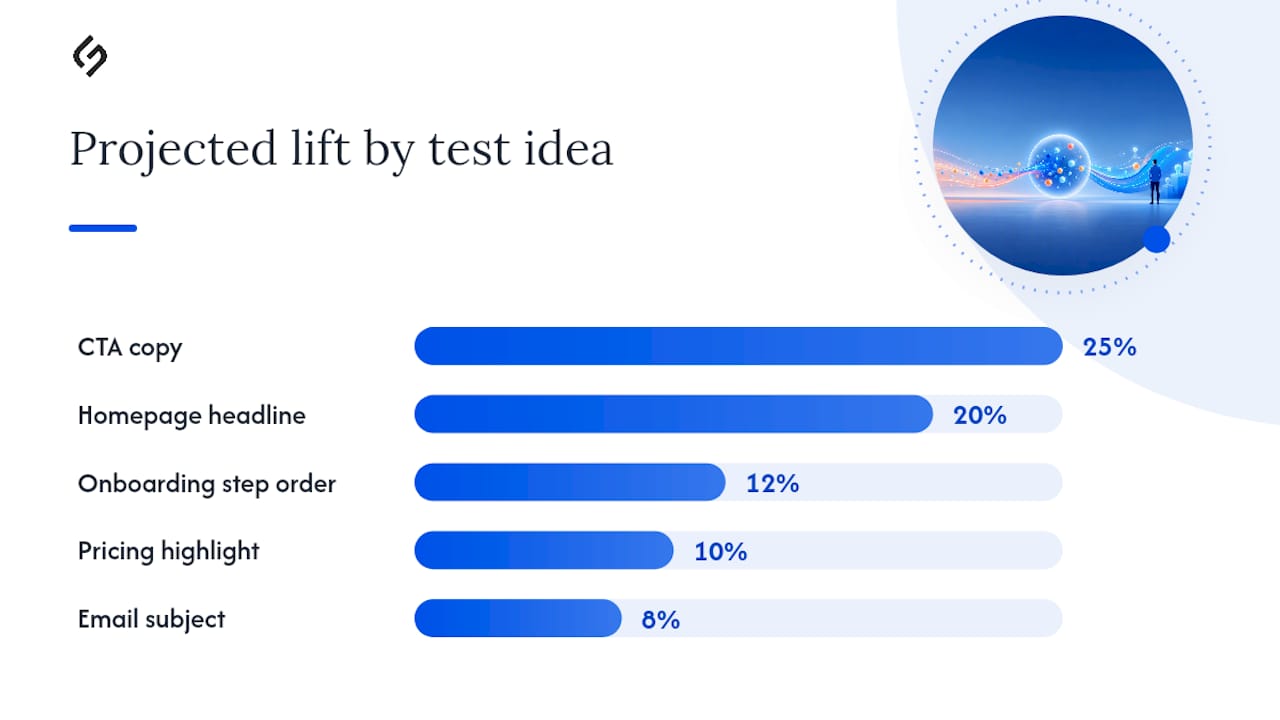
- Homepage headline: “Changing the headline from [generic tagline] to [specific value proposition] will increase scroll depth past the fold by at least 20% because users need to understand the offer before engaging.”
- CTA button copy: “Changing ‘Learn More’ to ‘See Pricing’ will increase clicks to the pricing page by at least 25% because it sets clearer expectations.”
- Pricing page layout: “Highlighting the mid-tier plan with a ‘Most Popular’ label will increase mid-tier selections by at least 10% because it reduces decision paralysis.”
Email tests:
- Subject line personalization: “Adding the recipient’s first name to the subject line will increase open rate by at least 8% because personalization signals relevance.”
- Send-time variation: “Sending at 10 AM Tuesday versus 2 PM Thursday will increase CTR by at least 5% because the audience is more likely to be at a desk mid-morning.”
App and onboarding tests:
- Step reordering: “Moving the profile photo upload step to after the first value moment will increase onboarding completion by at least 12% because users are more motivated after experiencing the product.”
For landing page optimization, small copy and layout changes often produce larger effects than visual redesigns. Start with high-traffic, high-intent pages where even a modest lift has measurable revenue impact.
Larger changes (layout restructuring, new feature introductions) typically require more traffic to detect an effect. Smaller copy or color changes may reach significance faster but tend to produce smaller absolute lifts.
What are the best practices and biggest pitfalls in A/B testing?
Best practices checklist:
- Write a structured hypothesis before touching any code.
- Define one primary metric and at least one guardrail metric before launch.
- Pre-calculate sample size and set a fixed runtime.
- Use deterministic, stable bucketing based on a persistent user identifier.
- Verify instrumentation with a pre-launch QA pass.
- Check for sample-ratio mismatch within the first 48 hours.
- Document every test, including losses and inconclusive results.
Common pitfalls:
- Peeking: Checking results before the planned endpoint and stopping early when significance is reached. Peeking and p-hacking are the leading causes of false positives in conversion optimization.
- Testing multiple changes at once: Makes it impossible to attribute the result to a specific change.
- Underpowered tests: Running a test with insufficient sample size produces results that cannot be trusted in either direction.
- Ignoring SRM: A sample-ratio mismatch means the randomization is broken. Results from a test with SRM are invalid.
- Novelty effects: A new variant may perform better initially simply because it is unfamiliar. Run tests long enough to capture stable behavior, typically at least one full business cycle.
- Stopping on a loss too quickly: An inconclusive or losing result still contains information. Document it and use it to refine the next hypothesis.
Pro Tip: Common operational mistakes include stopping tests early, changing the metric after launch, and running multiple independent tests on the same page without correcting for multiple comparisons. Build a pre-launch checklist and require sign-off before any test goes live.
Which A/B testing tools should you use?
Platform choice depends on traffic volume, technical resources, and how deeply the team needs to integrate test data with analytics infrastructure.
- Enterprise visual editors (Optimizely, VWO): Designed for product and marketing teams who need a point-and-click interface, built-in power calculators, and multi-page funnel support. Optimizely is well-suited for large organizations running dozens of concurrent tests with dedicated experimentation teams. VWO offers a more accessible entry point for mid-market teams, with heatmaps, session recordings, and A/B testing in one platform.
- Developer-friendly feature-flag stacks: Favor engineering workflows where variants are controlled via code flags rather than a visual editor. These tools support deterministic bucketing, gradual rollouts, and testing AI-driven features or personalization layers where behavioral regressions need careful monitoring.
- Analytics-native engines: Integrate directly with data warehouses (BigQuery, Snowflake) for teams that need custom metric definitions and full control over statistical analysis. These are appropriate when the built-in metrics of a visual editor are too rigid for the business model.
- Simple built-in tools: Email platforms (Mailchimp, Klaviyo) and ad platforms (Google Ads, Meta Ads Manager) include native A/B testing for subject lines, creative, and audience segments. These are sufficient for email and paid media tests but do not extend to on-site experimentation.
When choosing between a full platform and a feature-flag stack, the deciding factor is usually who owns the test. Marketing-led tests on landing pages favor visual editors. Engineering-led tests on product features favor feature flags with code-level control.
Pro Tip: Check whether a platform supports sequential testing or always-valid p-values before committing. These methods allow earlier stopping without inflating false-positive rates, which matters for teams running high-velocity experimentation programs.
How do teams integrate A/B testing into their workflow?
Experimentation at scale requires defined roles, a repeatable process, and governance to prevent low-quality tests from polluting the knowledge base.
Roles:
- Hypothesis owner (product manager or marketer): Writes the hypothesis, defines success criteria, and owns the decision.
- Engineer: Implements the variant, sets up bucketing, and verifies instrumentation.
- Data analyst: Validates the statistical setup, monitors for SRM, and interprets results.
- QA: Confirms both variants render correctly across devices and browsers.
- Decision owner: Reviews results and approves rollout, iteration, or abandonment.
Mini-workflow:
- Ideation: Collect test ideas from analytics, user research, and stakeholder input.
- Prioritization: Score ideas using an impact × confidence × effort framework. High-traffic pages with strong behavioral evidence rank first.
- Design: Write the hypothesis, select metrics, and calculate sample size.
- Instrument: Build the variant, wire tracking, and complete QA.
- Launch: Start the test and confirm the traffic split matches the intended ratio.
- Analyze: At the planned endpoint, check SRM, run the statistical test, and review guardrail metrics.
- Decide: Ship the winner, iterate on a loss, or retest an inconclusive result.
- Document: Record all findings in a shared test registry accessible to the full team.
A test backlog and registry serve two purposes. They prevent duplicate work and they build an institutional knowledge base that informs future UX design decisions and hypothesis quality over time.
What should you do when a test returns no clear winner?
An inconclusive result is not a failure. It means the tested change did not produce a detectable effect at the chosen MDE and power level, which is itself useful information.
Before accepting an inconclusive result, work through this checklist:
- Check power and sample size. Did the test reach the pre-calculated sample? If it ended early, the result is underpowered, not truly inconclusive.
- Inspect for SRM. A sample-ratio mismatch means the randomization failed. The result cannot be trusted.
- Validate instrumentation. Confirm that conversion events fired at the same rate for both groups and that no tracking discrepancy exists.
- Segment the results. Aggregate results can mask heterogeneous effects. A change that has no effect on desktop users may have a meaningful effect on mobile users, or vice versa. Segmenting by device, acquisition channel, or user cohort sometimes reveals a real signal.
- Consider raising the MDE. If the tested change is unlikely to produce a large effect, the test may need more traffic than is practical. A different element with a higher expected impact may be a better use of testing resources.
Next actions after a confirmed inconclusive result: revise the hypothesis based on what the data suggests, test a more aggressive version of the change, or shift focus to a different element on the page. Every inconclusive result narrows the hypothesis space and improves the quality of the next test.
Expert note: choosing the right statistical test and reducing variance
Practitioners who run high-velocity experimentation programs eventually encounter situations where the standard two-proportion z-test or Welch’s t-test is not the best choice.
When to use each test:
- Welch’s t-test: Appropriate for continuous metrics (revenue per visitor, session duration) where the two groups may have unequal variance. It is the industry standard for conversion metrics precisely because it does not assume equal variance.
- Two-proportion z-test / chi-squared: Appropriate for binary outcomes (converted vs. not converted) with large samples.
- Nonparametric tests (Mann-Whitney U): Useful when the metric distribution is heavily skewed and sample sizes are moderate. Revenue per visitor on e-commerce sites often has a long right tail that violates normality assumptions.
Variance-reduction techniques:
- CUPED (Controlled-experiment Using Pre-Experiment Data): Uses pre-experiment covariate data (e.g., a user’s behavior in the week before the test) to reduce the variance of the treatment effect estimate. This can reduce required sample size substantially without changing the test design.
- Stratification: Divides the population into subgroups (strata) before randomization to ensure balanced representation. Useful when a known covariate (device type, user tenure) strongly predicts the outcome.
- Blocking: Similar to stratification but applied at the assignment level. Ensures that each block contains an equal number of control and variant users.
Variance-reduction methods like CUPED are most valuable when pre-experiment data is available and the covariate is strongly correlated with the outcome metric. Applying them without a correlated covariate adds complexity without benefit.
These techniques are supported natively in some enterprise platforms and require custom implementation in others. For teams building an in-house experimentation stack, CUPED is worth implementing early because it effectively increases the sensitivity of every test without increasing traffic requirements.
Why small tests beat grand experiments every time
There is a persistent belief in product and marketing teams that a single, well-designed “big” experiment will produce a decisive insight. In practice, the opposite tends to be true.

Small, focused tests with clear hypotheses produce faster learning cycles. A team running ten two-week tests per quarter learns more about user behavior than a team running one eight-week test, even if the individual effect sizes are smaller. The compounding value is in the documentation: each result, including null results, refines the team’s model of what users respond to.
The teams that build genuine experimentation maturity share a few habits. They celebrate null results as much as wins, because a null result eliminates a hypothesis and prevents future wasted effort. They share test results across functions, so a finding from a marketing email test informs a product onboarding hypothesis. And they maintain a test registry that anyone in the organization can search.
A small example illustrates the point. A team testing a single-word change to a checkout button (“Buy” versus “Complete Order”) might expect a negligible result. But if the test reveals that “Complete Order” reduces checkout abandonment on mobile by a meaningful margin while having no effect on desktop, that segmented insight reshapes how the team thinks about mobile copy across the entire funnel. The test was small. The learning was not.
Start with the highest-traffic, highest-intent pages. Build the discipline of writing structured hypotheses and documenting results. The experimentation muscle develops through repetition, not through occasional grand gestures.
How Solution For guru helps you implement and act on A/B test results
Running a valid A/B test is one challenge. Implementing the winning variant correctly, wiring analytics to capture the right events, and building the technical infrastructure to support ongoing experimentation is another.
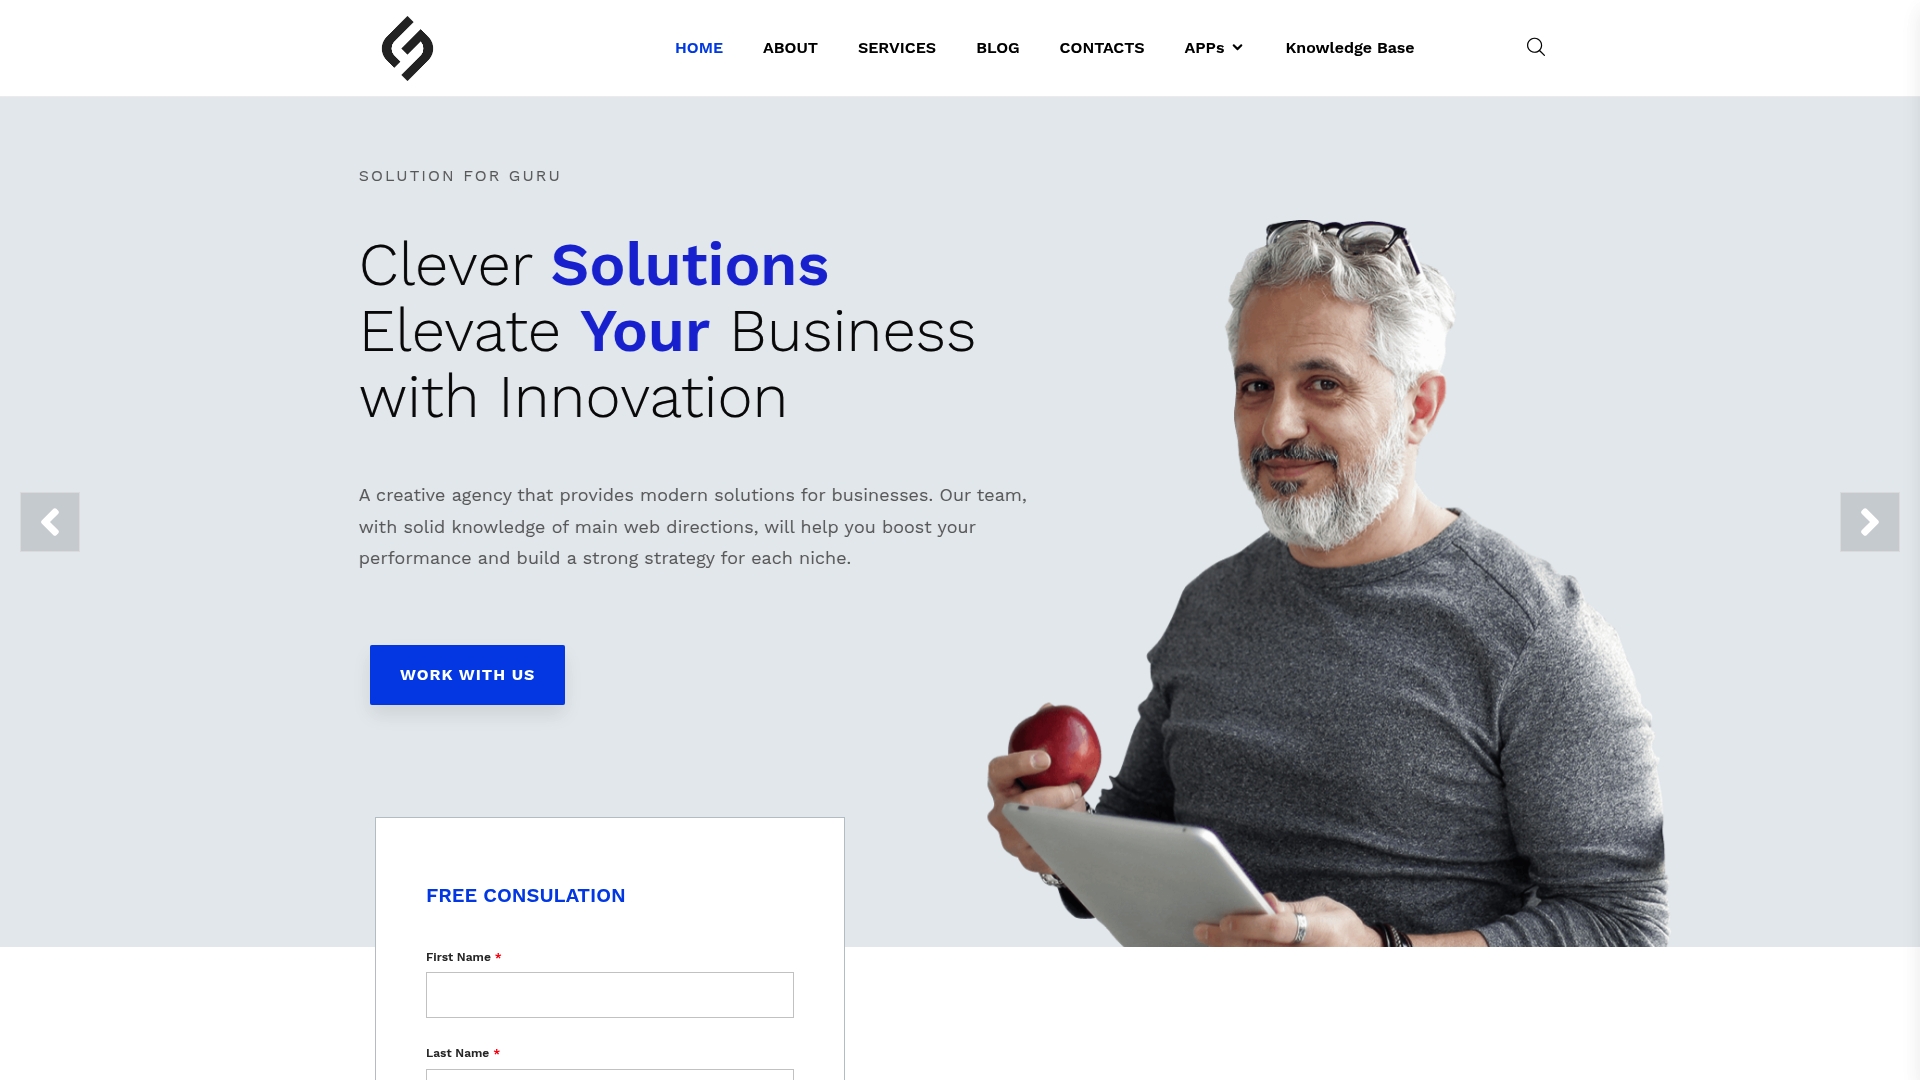
Solution For guru works with product teams and marketers to set up the technical foundation that makes experimentation reliable: analytics instrumentation, event tracking, variant deployment, and UX design implementation for test winners. Whether you need help designing your first experiment, auditing an existing testing setup, or building a full experimentation framework into your web or app platform, the team brings both the technical depth and the strategic perspective to move fast without cutting corners. The work covers everything from web development basics and tracking setup to hypothesis prioritization and post-test rollout. Book a free consultation at Solution For guru to discuss your experimentation goals and get a clear next step.
Sources
The following references were used in preparing this guide and are recommended for deeper study:
- A/B Testing 101 – Nielsen Norman Group
- A/B testing – Wikipedia
- How to Run an A/B Test in 2026 – A Step-by-Step Practical Guide | ABTesting
- A/B Testing Methodology: Statistical | Digital Codex
- A/B Testing: What it is, How it Works, and How to do an A/B Test
FAQ
A/B testing is a randomized controlled experiment that assigns users to a control group or a variant group and uses statistical hypothesis testing to determine whether the observed difference in a primary metric is likely to reflect a real effect rather than random variation.
Use A/B testing when you have a specific, measurable outcome, enough traffic to reach statistical significance within a practical timeframe, and a defined hypothesis about what change to make. For early-stage discovery or radical redesigns, qualitative research or prototyping is more appropriate.
An A/B test is the overall experimental framework; a t-test (specifically Welch’s t-test) is one of the statistical methods used to analyze the results. Welch’s t-test compares the means of two groups without assuming equal variance, making it well-suited for continuous metrics like revenue per visitor in A/B testing contexts.
There is no universal minimum. Required traffic depends on baseline conversion rate, the minimum detectable effect you care about, your significance threshold (alpha), and target power. A lower baseline conversion rate and a smaller MDE both increase the required sample size substantially.
The most common causes are stopping the test early after seeing a promising result (peeking), a sample-ratio mismatch indicating broken randomization, changing the primary metric after launch, and running the test with insufficient sample size to detect the targeted effect.
Recommended
- How to Increase Website Conversions: 2026 Guide – Solution for Guru
- Optimize Landing Pages: A Practitioner’s Playbook – Solution for Guru
- Email Marketing Essentials: Grow Your Business with Effective Campaigns – Solution for Guru
- Understanding the Difference Between B2B and B2C Marketing – Solution for Guru