Measuring User Engagement: A Metric-First Guide for Product Teams

Measuring user engagement means quantifying outcome-tied actions, not raw activity. A page view is activity. A completed setup flow that predicts 90-day retention is engagement. Treat them as different things, and every downstream metric gets sharper.
Product teams need five metric families to do this well: activity metrics (DAU, WAU, MAU), session metrics (length, engaged sessions), feature metrics (adoption, retention), journey metrics (funnels, time-to-value), and outcome metrics (NPS, CSAT, task completion). None of these work in isolation.
The immediate approach: pick your value actions first, instrument the events cleanly, segment before you look at any number, then validate suspicious moves with an experiment rather than a hunch.
- Define 2 to 3 value actions tied to retention, not vanity clicks
- Instrument events with consistent naming before you trust any dashboard
- Segment by persona, tier, and channel before drawing conclusions
- Confirm real shifts with an A/B test, not a single week’s trend line
Pro Tip: If you can’t say which decision a metric will change, don’t build the dashboard yet. Build the decision rule first.
Key Takeaways
Reliable engagement measurement requires defined value actions, clean event instrumentation, deliberate segmentation, and experimental validation before any metric drives a decision.
| Point | Details |
|---|---|
| Define value actions first | Write a one-sentence definition for activation, retention, and habit before choosing a metric. |
| Set population and time window | Decide whether you’re counting users, sessions, or accounts, and over what period. |
| Segment before interpreting | Break out persona, tier, channel, and agent-versus-human traffic before trusting an aggregate number. |
| Validate instrumentation regularly | Audit events quarterly to catch drift, duplicates, and broken tracking. |
| Act through experiments | Tie engagement metrics to A/B tests with defined primary and guardrail metrics before scaling a change. |
Table of Contents
- Core Engagement Metrics: Definitions, Formulas, and When to Use Them
- How Do You Choose the Right Engagement Metrics?
- Instrumentation and Tools for Tracking Engagement Accurately
- How Should You Segment Engagement Data?
- Why Does High Engagement Sometimes Signal a Problem?
- Turning Engagement Metrics Into Action
- Where This Guidance Comes From
- Ready to Fix Your Engagement Measurement?
- An Editorial Take on What Actually Moves the Needle
- Sources
- FAQ
Core Engagement Metrics: Definitions, Formulas, and When to Use Them
Every engagement metric answers a different question, and mixing them up is the fastest way to make a bad call look data-backed.
1. DAU, WAU, and MAU. Daily, weekly, and monthly active users count unique users performing any tracked action in that window. The formula is simple: count distinct user IDs per period. The interpretation is not. A weekly-cadence product (think expense reporting) will always show low DAU relative to MAU, and that’s not a problem, it’s the product’s natural rhythm.
2. Stickiness (DAU/MAU). This ratio estimates how often monthly users return daily. A ratio above 20% is often cited as healthy for consumer apps, but the metric misleads when product cadence is weekly or monthly rather than daily. Filter it down to meaningful actions, not raw logins, before trusting it.
3. Average session length and engaged sessions. Time on page seems intuitive until you realize a long session might mean deep engagement or a confused user stuck in a support loop. GA4 solves part of this by tracking engagement_time_msec, which counts active in-focus time rather than raw elapsed time. Web sessions tend to measure this cleanly. App sessions can overcount because background processes sometimes keep registering as active time.
4. Feature metrics: activation, adoption, retention. Activation rate is the share of new users who complete your defined first-value moment (formula: activated users ÷ new users). Feature adoption is users who tried a feature at least once ÷ total eligible users. Feature retention is users who used it again in a later period ÷ users who used it once. These three numbers together tell you whether a feature is discovered, tried, and kept.
5. Funnel metrics and time-to-complete. Track conversion at each funnel step and the median time between steps. A funnel that converts well but takes three days to clear a step that should take three minutes is telling you something a conversion rate alone won’t.
Let’s take a closer look.
| Metric | Formula | Best used for |
|---|---|---|
| DAU/MAU (stickiness) | Daily actives ÷ monthly actives | Habit-forming, daily-use products |
| Activation rate | Activated users ÷ new users | First-value onboarding success |
| Feature adoption | Users who tried feature ÷ eligible users | Feature discovery and rollout health |
| Engaged sessions | Sessions with meaningful interaction ÷ total sessions | Web content and app usage quality |
| Time-to-value | Median time from signup to first value action | Onboarding friction diagnosis |
Practitioner surveys of online engagement metrics consistently flag clickthrough rate and page views as weak standalone signals. They correlate loosely with real engagement and break down entirely once bots or scrapers enter the traffic mix.
How Do You Choose the Right Engagement Metrics?
The metric that matters depends entirely on your business model. A B2B SaaS product cares about weekly active accounts and feature adoption inside the first 30 days. A content site cares about scroll depth, return visits, and time-to-first-story. An e-commerce platform cares about add-to-cart rate and repeat purchase interval. Pulling a generic “engagement score” from a template and applying it across all three is how dashboards become decoration.
Start by defining your value action with precision. Is it activation (first meaningful outcome), retention (coming back), or habit (coming back without a prompt)? These require different denominators and different time windows.
Before you calculate anything, set the population, the event, and the time window explicitly. Are you counting users, sessions, or accounts? A week or a rolling 28 days? Skipping this step is the single most common reason two teams report different numbers for what they think is the same metric.
- Map your business model to the right metric family before picking a KPI
- Write a one-sentence definition for every value action (“activation = user creates first project within 7 days”)
- Name events consistently (object_verb format, like
report_exported) and assign an owner to the taxonomy - Run a validation pass: does this metric change a real decision, or is it just interesting?
Pro Tip: Ask your team to write down what decision a metric will trigger before you build it. If nobody can answer, the metric probably belongs in a report, not a dashboard.
Instrumentation and Tools for Tracking Engagement Accurately
Your metrics are only as good as the events feeding them. GA4’s engagement model tracks engagement_time_msec, counting focused time rather than idle tabs, but app streams on certain platforms can inflate that number when background activity keeps registering. Cross-check app engagement against foreground events before trusting the duration figure.
Product analytics platforms (event-based tools tracking specific user actions) handle feature-level metrics and funnels far better than page-based web analytics, because they let you define a “value action” as a custom event rather than a URL hit.

Heatmaps and session replay tools surface the UX friction that clean metrics hide. A funnel step converting at 40% doesn’t tell you why the other 60% left. Watching five session replays often does.
For teams joining data across systems, a data warehouse pulling analytics, CRM, and event data into one place beats stitching reports together manually. It also catches the silent failures, like an event that stopped firing after a code deploy three weeks ago and nobody noticed until the weekly number cratered.
- Validate GA4 app engagement against foreground event patterns, not raw duration
- Use product analytics for feature-level funnels, not just page traffic
- Run heatmaps or session replay whenever a metric moves and you don’t know why
- Set up automated alerts for event volume drift, not just metric-value drift
- Solution4guru’s work on interactive website features covers UI patterns that make instrumentation and engagement improvements easier to pair together
Pro Tip: Schedule a quarterly “event audit” where someone checks whether every tracked event still fires correctly. Broken instrumentation is invisible until the numbers stop making sense.
How Should You Segment Engagement Data?
Aggregate engagement numbers hide almost everything useful. A minimum viable segmentation plan needs five cuts: persona (job-to-be-done), subscription tier, acquisition channel, device type, and agent versus human traffic.
Cohort analysis groups users by shared start date (signup week, plan upgrade date) and tracks their behavior over time, which reveals whether engagement is improving for new users or just for legacy ones propping up the average. Choose cohort windows that match your product cycle, weekly for high-frequency apps, monthly for considered-purchase software.
Agent and automated traffic deserves its own bucket entirely. AI agents making API calls break session-based assumptions that most analytics tools were built around, inflating session counts or event volume in ways that look like human engagement growth but aren’t. A minimal 2026 segmentation plan tags agent traffic at the API level and treats subscription tier as a first-class dimension, which turns nearly every metric into something diagnostic instead of decorative.
- Segment by persona, tier, channel, device, and agent-vs-human as a baseline
- Choose cohort windows that match your natural usage cycle, not a default 30 days
- Tag and isolate agent traffic before calculating session-based metrics
- Compare segment-level trends, not just the blended average, when a metric shifts
Why Does High Engagement Sometimes Signal a Problem?
Engagement data lies in specific, predictable ways. Learn the patterns and you’ll stop chasing ghosts.
- Background app time inflates duration. A phone left open with the app in the background can register as active engagement time on some platforms, padding session length without any real interaction.
- Bots and scrapers pad pageviews and CTR. Traffic-source review should be a standing habit, not a one-time cleanup.
- Long sessions can mean confusion, not delight. A support tool where users spend 12 minutes per session isn’t necessarily beloved. It might mean the answer they need is buried.
- Duplicate events double-count actions. A retry on a slow network can fire the same event twice, quietly doubling a conversion metric.
- Internal and QA traffic contaminates the baseline. Filter your own team’s usage before publishing any engagement number externally.
When a metric moves unexpectedly, run this triage: check event volume for drift, filter internal and bot traffic, confirm the change lines up with a real product or marketing shift, then segment before concluding anything.
Pro Tip: If a metric improves right after a deploy but nothing in the release notes explains why, assume a tracking bug before you assume a win.
Turning Engagement Metrics Into Action
Metrics only earn their keep when they change a decision. That means tying them to experiments, not just reports.
- Define primary and guardrail metrics before launching a test. Your primary metric might be activation rate; your guardrail might be support ticket volume, so you catch a win that’s secretly causing pain elsewhere.
- Weight internal cohort movement over external benchmarks. A published industry average tells you where the pack sits. Your own cohort trend tells you whether last month’s onboarding change actually worked.
- Prioritize time-to-value and activation first. These are consistently the highest-leverage levers for product-led growth, because a slow first-value moment quietly kills retention before it even has a chance to start.
- Run the experiment, then segment the results. An A/B test that looks flat overall can hide a strong win in one persona and a loss in another.
Solution4guru’s guide to A/B testing walks through setting up guardrail metrics correctly, and the conversion optimization playbook covers turning engagement wins into revenue outcomes.
Where This Guidance Comes From
Solution4guru works across UI/UX design, analytics instrumentation, and digital marketing for clients who need engagement numbers that hold up under scrutiny, not just dashboards that look busy. That work spans e-commerce clients optimizing checkout funnels and B2B SaaS clients redefining what “activation” means for their onboarding flow.
- Web development and instrumentation work informed by real client event taxonomy projects
- UI/UX consulting that ties design changes directly to feature adoption metrics
- Digital marketing engagements measured against retention, not just click volume
- Digital marketing ROI frameworks applied across client engagement audits
Ready to Fix Your Engagement Measurement?
Most engagement dashboards fail for one of two reasons: nobody defined the value action clearly, or the instrumentation drifted months ago and nobody noticed. Both are fixable, but they usually require an outside audit to catch what internal teams have stopped seeing.
Solution4guru builds the interactive website features and instrumentation architecture that make engagement measurement trustworthy from day one, rather than something you patch together after the dashboards stop making sense. If your team is ready to define value actions properly, clean up event taxonomy, and connect engagement metrics to real product decisions, reach out to Solution4guru for a consultation.
An Editorial Take on What Actually Moves the Needle
Most engagement advice treats every metric as equally important, and that’s the core failure. Time-to-value and activation rate carry more decision weight than a dozen vanity metrics combined, because a slow first-value moment poisons every metric downstream of it. If your onboarding takes two weeks to deliver value, no amount of dashboard sophistication will fix the retention curve that follows.
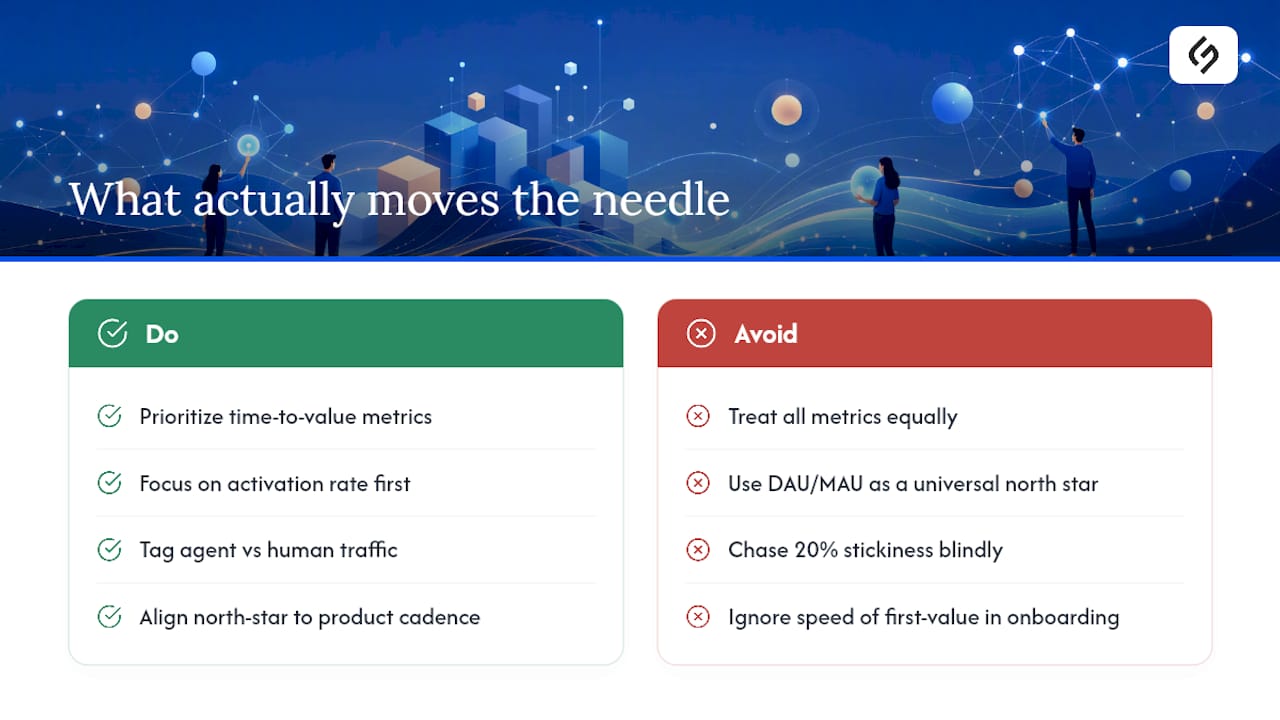
The conventional wisdom oversells DAU/MAU as a universal north star. It’s a fine metric for daily-habit products and actively misleading for anything with a weekly or monthly natural cadence. Teams that chase a 20% stickiness benchmark regardless of product type end up optimizing for logins nobody wanted.
The agent-versus-human segmentation issue deserves far more attention than it gets. As AI agents increasingly interact with products through API calls, session-based metrics quietly inflate in ways that look like growth but aren’t. Tag that traffic first. Everything else you measure depends on getting that distinction right.
Sources
- User engagement – Analytics Help
- Measuring User Engagement (Springer)
- Measuring User Engagement (ACM / Lalmas et al.)
- User Engagement: Definition, Tracking And Improvement
- Product engagement metrics to track in 2026 | Userpilot
FAQ
Define a specific value action tied to retention, instrument the event cleanly, set the population and time window, then calculate the rate against a clear denominator. Segment the result before drawing conclusions, since aggregate numbers hide most real problems.
Track weekly active accounts (not just users), feature adoption within the account, and time-to-value for the account’s first meaningful outcome. Segment by subscription tier since enterprise and self-serve accounts typically show very different engagement patterns.
There’s no single universal formula. The most common approach follows a five-step process: define the value action, set the population and time window, choose the denominator, apply the rate calculation, then segment the result. DAU/MAU is one common formula, calculated as daily active users divided by monthly active users.
Definitions vary across studies, but engagement is generally treated as a multidimensional construct spanning behavior, attention, and emotion rather than a single numeric scale. Academic research on measuring engagement recommends combining behavioral analytics with qualitative measures like surveys to capture that full picture.