Increase Marketing ROI: A Measurement-First Playbook

The single highest-impact move to increase marketing ROI is to measure incremental returns for each channel, then reallocate budget toward whichever ones deliver the best risk-adjusted marginal return. Attributed ROAS numbers from ad platforms overstate impact, hide diminishing returns, and reward whichever channel happens to sit closest to the last click. Fix the measurement first. The reallocation almost takes care of itself.
Before you read further, here’s what to do this week:
- Run one incrementality test (a geo holdout works fine) on your largest spend channel.
- Audit your UTM governance. Broken or inconsistent tagging is the single most common cause of bad attribution data.
- Build a lightweight Marketing Mix Model (MMM) or work through the measurement guide if you don’t have the internal data science bandwidth yet.
- Shift 10 to 30 percent of budget toward the channel with the strongest risk-adjusted marginal return, based on what the test tells you, not what the platform dashboard claims.
Pro Tip: Size any reallocation like a portfolio manager, not a gambler. A fractional Kelly approach, moving a portion of what full confidence would justify, protects you from acting on a noisy signal and destabilizing platform algorithms mid-quarter.
Key Takeaways
Marketing ROI improves fastest when teams measure incremental returns first and size budget shifts by risk-adjusted confidence, not raw attributed performance.
| Point | Details |
|---|---|
| Measure incrementality, not last-click | Use holdout tests or geo-experiments before trusting any channel’s reported ROAS. |
| Fix data foundations before optimizing | UTM governance and event-to-revenue mapping must come before advanced tactics. |
| Size budget shifts by confidence, not hype | Use a fractional Kelly approach and cap reallocations at 30% per channel per quarter. |
| Protect brand spend | Keep roughly half of media investment in brand-building to preserve long-term performance efficiency. |
| Get measurement infrastructure built right | Solution4guru sets up the tracking, dashboards, and allocation models this playbook depends on. |
Table of Contents
- What Increases Marketing ROI vs. What Just Looks Efficient
- How Do You Measure Marketing ROI Accurately?
- Practical Tactics to Increase Marketing ROI Right Now
- Experiments, MMM, or Multi-Touch Attribution: Which Fits Your Business?
- A Capital-Allocation Framework for Smarter Marketing Budgets
- KPIs, Dashboards, and Tools You Actually Need
- How Long Does It Take to See ROI Improvements?
- What Improved Measurement Actually Produced
- Why Brand Awareness Still Drives Long-Term ROI
- What Most Teams Get Wrong About ROI
- How Solution4guru Helps You Put This Into Practice
- Sources
- FAQ
What Increases Marketing ROI vs. What Just Looks Efficient
Marketing ROI and marketing efficiency get used interchangeably, and that’s where most budgeting mistakes start. Marketing ROI measures the return generated per dollar spent, expressed as (revenue attributable to marketing minus marketing cost) divided by marketing cost. Obviously, Marketing efficiency is a broader idea: how well your total marketing system converts spend into durable business value, including effects that don’t show up in a 30-day attribution window. Incremental return is the gap between what a platform’s attribution model credits and what actually would not have happened without that spend.
A full ROI calculation needs several inputs working together, not just one dashboard metric:
- Revenue and conversions tied to specific campaigns
- Customer acquisition cost (CAC)
- Customer lifetime value (CLTV)
- Cost per acquisition (CPA) at the channel level
- Return on ad spend (ROAS) as a directional signal only
- Incremental revenue, isolated through testing
Here’s the gap in practice. A retargeting campaign might report a 6x last-click ROAS. Run a holdout test on the same audience, and the incremental lift often comes in far lower, because much of that “attributed” revenue would have converted anyway. NetSuite’s guide to marketing ROI walks through how CLTV and margin adjustments change the calculation further, and why a raw revenue-over-cost formula can mislead finance teams who don’t see the full picture.
How Do You Measure Marketing ROI Accurately?
Start with the formula, then adjust it for your business model. The canonical version is:
Marketing ROI = (Revenue Attributable to Marketing − Marketing Cost) ÷ Marketing Cost
Three variants matter in practice:
- Simple campaign ROI — revenue and cost at the campaign level, useful for quick comparisons but blind to margin differences.
- Margin-adjusted ROI — substitutes gross profit for revenue, which matters enormously if you sell products with different margins across channels.
- CLTV-adjusted ROI — replaces first-purchase revenue with projected lifetime value, essential for subscription or repeat-purchase businesses where the first sale often loses money.
None of these variants fix the deeper problem: attribution models assign credit, they don’t measure causation. That’s where incremental measurement comes in.
Holdout tests withhold a channel or campaign from a randomized slice of your audience and compare outcomes against the group that saw it. They work well for email, direct mail, and paid social when you control audience assignment. Geo-experiments turn off or dial back spend in selected markets and compare performance against matched control markets. They’re the standard for measuring channels like TV, out-of-home, or broad-reach digital where individual-level holdouts aren’t feasible. Incrementality testing is the umbrella term for both, and it should replace attributed ROAS as your primary decision metric wherever conversion volume allows it.
A practical measurement checklist looks like this:
- Data inventory — catalog every data source touching revenue: ad platforms, CRM, e-commerce backend, call tracking, offline sales if relevant.
- UTM governance — standardize naming conventions across every team and agency touching campaigns; inconsistent UTMs are the single largest source of attribution error.
- Event-to-revenue mapping — confirm that the conversion events your ad platforms optimize toward actually map to real revenue, not proxy metrics like “add to cart.”
- Attribution model selection — pick a model (data-driven, position-based, or last-click) that matches your sales cycle length and document why.
- MMM when appropriate — once you have enough historical spend and revenue data, layer in a Marketing Mix Model to capture channel interactions and long-term effects attribution models miss entirely.
- Validation cadence — recheck your attribution setup quarterly against incrementality test results; models drift as consumer behavior and platform algorithms change.
Skipping the data inventory step is the most common failure point. Teams jump straight to dashboards without confirming that the revenue number feeding those dashboards is even correct. Fix the plumbing before you optimize the pressure.
Practical Tactics to Increase Marketing ROI Right Now
Not every tactic belongs at the top of your list. Sequence matters, and a practitioner analysis from Improvado’s tactics guide makes the case clearly: foundational fixes like UTM governance and cross-device matching need to happen before advanced optimization work, or the advanced work optimizes against bad data.
Here’s the sequence, organized by attribution maturity level.
First, If your attribution maturity is low (you’re not confident your conversion data is accurate):
- Fix UTM governance and data hygiene. This has no minimum data threshold, it just needs discipline and a shared naming convention document across every team and agency.
- Map event-to-revenue connections. Confirm your CRM and ad platforms agree on what counts as a conversion. Tools like a connected CRM system close this gap by tying marketing touches directly to closed revenue.
- Establish cross-device matching. Without it, you’ll systematically undercount mobile-to-desktop conversion paths, which skews channel comparisons.
Second, If your attribution maturity is medium (data is clean, but you’re not testing systematically):
- Build a real A/B testing framework. One test at a time, with a predefined minimum sample size and a hard stop date, beats ad hoc “let’s just try this” experiments that never get evaluated honestly.
- Run creative testing on a schedule. Rotate ad creative variants every 2 to 4 weeks; creative fatigue is often the biggest unaddressed drag on ROAS, and it’s cheaper to fix than bid strategy.
- Optimize bid strategy deliberately. Test automated bidding against manual controls on a defined budget slice rather than switching platform-wide overnight.
- Build audience micro-segments. Segment by behavior and value tier, not just demographics, and test messaging differences between segments.
Third, If your attribution maturity is high (you’re running experiments and want to scale intelligently):
- Layer personalization onto proven segments. Only personalize once you know which segments actually respond differently, otherwise you’re adding complexity without lift.
- Repurpose top-performing content across the funnel. A single strong case study can become a landing page, an email sequence, and a retargeting ad. This cuts creative production cost while compounding reach.
- Balance brand and performance investment deliberately. Don’t let short-term optimization crowd out the upper-funnel work that builds future demand.
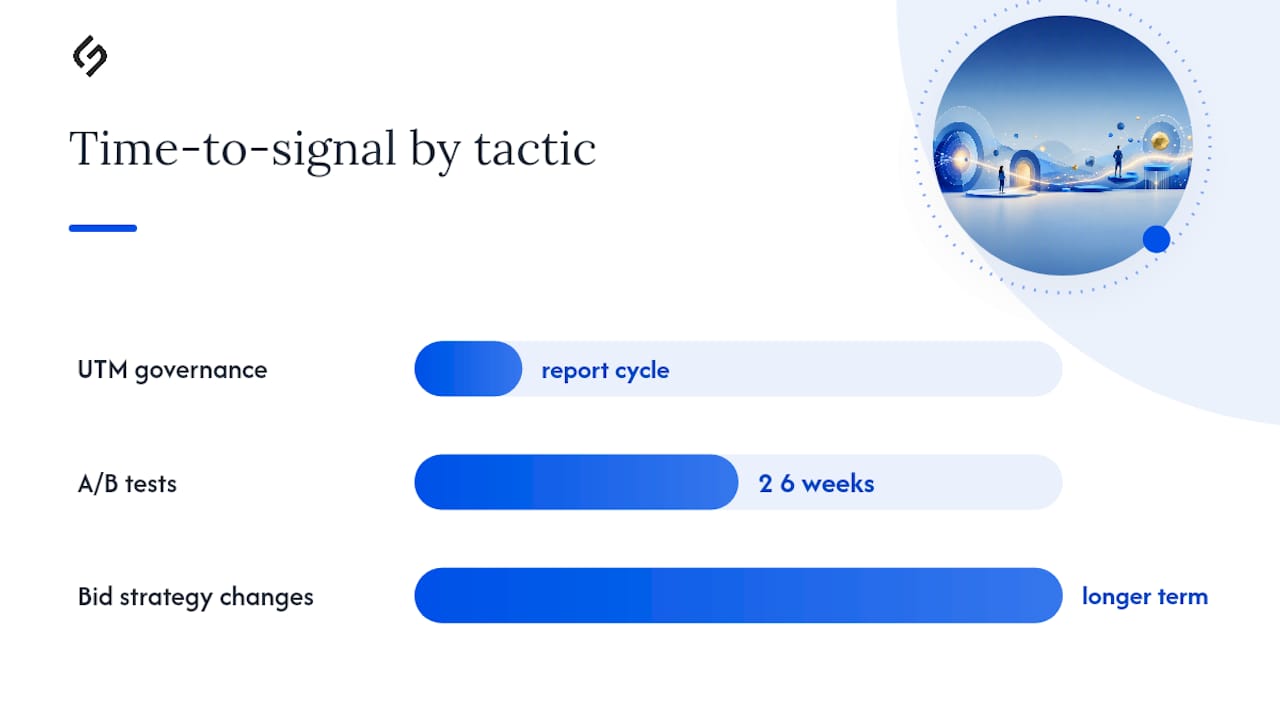
Expected time-to-signal varies by tactic. UTM fixes show clean data within a reporting cycle. A/B tests typically need 2 to 4 weeks depending on traffic volume. Bid strategy changes take longer to stabilize because ad platforms need a learning period before performance normalizes.
Pro Tip: Don’t run more than two or three tests simultaneously on the same channel. Overlapping tests contaminate each other’s results, and you’ll spend a month debating which change actually caused the lift you saw.
For channel-level prioritization, review where your audience actually spends attention. Pew Research’s social media data is a useful sanity check before committing test budget to a platform your audience has already moved away from.
Experiments, MMM, or Multi-Touch Attribution: Which Fits Your Business?
The right measurement approach depends on your conversion volume, your business model, and how much of your marketing spend goes toward long-horizon brand effects versus immediate response.
Incrementality testing (holdouts and geo-experiments) gives you the cleanest causal read, but it requires enough conversion volume to reach statistical confidence within a reasonable test window, and it only measures the channel you’re testing at that moment.
Multi-touch attribution distributes credit across every touchpoint in a customer’s path. It’s useful for understanding sequence and assist patterns, but it still relies on tracking data that’s degrading as cookie deprecation and privacy restrictions expand, and it can’t tell you what would have happened without the spend.
Marketing Mix Modeling uses aggregated historical data (spend, revenue, external factors like seasonality) to estimate each channel’s contribution, including channels like TV or brand campaigns that don’t generate trackable clicks. It captures long-term and halo effects that individual-level attribution misses entirely, but it needs a longer runway of historical data and doesn’t respond well to real-time optimization questions.
Let’s take a closer look.
| Dimension | Incrementality Testing | Multi-Touch Attribution | Marketing Mix Modeling |
|---|---|---|---|
| Data requirement | Moderate, needs controlled test groups | High, needs granular tracking data | Low granularity, but needs 1–2+ years of history |
| Time horizon captured | Short to medium term | Short term | Short and long term, including brand effects |
| Relative cost | Moderate, ongoing test cycles | Low to moderate, mostly tooling | Higher upfront, lower ongoing |
| Best use case | Validating specific channel or campaign lift | Understanding path and sequence | Total budget allocation across all channels |
| Granularity | Campaign or channel level | Touchpoint level | Channel or channel-group level |
Choosing between them isn’t binary. If you’re running fewer than a few hundred conversions a month, incrementality testing alone won’t reach significance quickly, so lean on directional multi-touch data while you build an MMM foundation. If you have healthy conversion volume and want to validate a specific channel decision fast, run a geo-experiment.Also, if you’re setting an annual or quarterly budget across every channel including brand spend, MMM is the only approach built for that question.
A practical minimum: most teams need at least 12 to 18 months of consistent spend and revenue data before an MMM produces stable, trustworthy output. Below that, treat MMM results as directional, not final.
A Capital-Allocation Framework for Smarter Marketing Budgets
Most marketing budgets get set the same way every year: last year’s number plus a percentage bump, distributed roughly the way it always has been. A research-backed capital-allocation framework treats marketing spend the way a portfolio manager treats capital, and it beats rule-of-thumb budgeting consistently.
The framework has four steps:
- Measure incremental returns for every channel using the testing methods above, not attributed ROAS.
- Quantify uncertainty. Every incrementality test produces a confidence interval, not a single number. A channel showing 3x ROI with a wide interval is a riskier bet than one showing 2.2x with a tight interval.
- Map the efficient frontier. Plot expected return against uncertainty for each channel, the same way you’d plot risk against return for a set of investments. Some channels are high-return, high-variance. Others are steady and dependable but capped.
- Size bets with a fractional Kelly approach. Rather than betting the full amount the data suggests, size the reallocation at a fraction of that, cushioning against model error and shifting market conditions, then run a value-at-risk check before committing.
Here’s the practical difference. The naive approach is faster. The risk-adjusted approach survives contact with reality.
Pro Tip: Recalibrate quarterly, not monthly. Moving faster than that risks resetting ad-platform learning phases, which can temporarily tank performance right when you need clean data most.
KPIs, Dashboards, and Tools You Actually Need
Track fewer metrics, but track the right ones. A dashboard overloaded with vanity numbers slows decisions instead of speeding them up.
Core KPIs worth tracking on a recurring cadence:
- Revenue and incremental revenue (separately, not blended)
- CAC and CLTV, tracked by channel and by segment
- ROAS alongside incremental ROAS (iROAS), shown side by side to expose the gap
- Conversion rate by funnel stage
- Churn rate, if your model is subscription or repeat-purchase
- Marketing value-at-risk (VaR), a measure of how much a reallocation could underperform in a worst-case scenario
Your dashboard should include a data-source view (what’s feeding the numbers), an attribution comparison view, MMM output when available, confidence intervals on every incremental figure, an efficient-frontier chart, and a reforecast panel for the next allocation cycle. On tooling, most teams combine a standard analytics platform, a CDP for identity resolution, and either an MMM vendor or an in-house model once data volume supports it. Experiment platforms handle the holdout and geo-test logistics. Integration between these systems matters more than any single tool’s feature list.
How Long Does It Take to See ROI Improvements?
Set expectations by activity, not by a single blanket timeline.
- Quick wins (2 to 8 weeks): UTM cleanup, basic A/B tests, and creative refreshes show measurable signal fastest because they don’t require new infrastructure.
- Measurement foundation (2 to 3 months): Building cross-device matching and a working MMM takes longer, since it depends on data engineering time and enough historical volume to produce stable output.
- Full capital-allocation deployment (3 to 6+ months): Rolling out risk-adjusted budget sizing across every channel, with quarterly recalibration built in, is a multi-quarter commitment, not a one-time project.
Cost scales with ambition. Basic dashboard and UTM cleanup work costs little beyond internal time. MMM tooling ranges from mid-tier analytics platforms to enterprise licenses, and data engineering time is often the hidden cost teams underestimate. Bring in outside specialists when your team lacks data science bandwidth or when conversion volume is too low for confident in-house incrementality testing. Whatever the pace, phase reallocations gradually and cap channel-level changes early, the same guardrail Grammarly’s BEAM allocation tool enforces to avoid destabilizing ad-platform learning during rollout.
What Improved Measurement Actually Produced
Three patterns show up repeatedly once teams fix measurement and reallocate deliberately.
- Attribution correction: One team discovered their top “performing” retargeting campaign showed minimal incremental lift once tested with a holdout group; budget moved to a genuinely underfunded channel and total incremental revenue rose. The lesson: attributed ROAS had been rewarding the wrong channel for over a year.
- Systematic reallocation: Atlassian’s ML-driven budget optimization redistributed existing spend across segments using a payout-prediction model, improving efficiency without increasing total budget.
- Brand’s long game: A team that had cut upper-funnel spend to fund short-term performance campaigns saw the performance channel efficiency degrade over several quarters as brand awareness eroded, illustrating why long-term effects can’t be ignored in short-term optimization.
Why Brand Awareness Still Drives Long-Term ROI
Cutting brand spend to fund short-term performance campaigns is one of the most common ROI mistakes marketing managers make, because the damage shows up slowly and doesn’t appear in any weekly dashboard. Google’s analysis with WARC recommends dedicating roughly 50 to 60% of media investment to brand-building activities and the remainder to performance tactics, specifically because short-term optimization systematically misses a large share of total marketing value.

Here’s why the split matters. Performance channels compete for demand that already exists, someone searching a brand name or clicking a retargeting ad has usually already decided to consider you. Brand-building creates that demand in the first place. Starve it, and performance channels eventually run out of warm audience to convert, even though the dashboards looked fine for a few quarters while the effect built up.
This is also why incrementality testing and MMM matter more than attributed ROAS specifically for brand spend. A brand campaign rarely shows a clean last-click conversion, but an MMM can detect its lift on search volume, direct traffic, and conversion rates across every other channel months later. Teams that only measure what a pixel can track will always undervalue brand work, then wonder why performance channels get more expensive over time. Building brand equity deliberately isn’t a nice-to-have sitting outside your ROI calculation. It’s a direct input into how efficient every other channel remains next year.
What Most Teams Get Wrong About ROI
Overreliance on last-click attribution is the mistake I see most often, and it’s rarely a knowledge gap. Teams know last-click overstates certain channels. They keep using it anyway because it’s fast, familiar, and easy to defend in a budget meeting. The harder miss is underestimating uncertainty: a channel reporting 4x ROI off a two-week sample gets treated with the same confidence as one backed by a quarter of consistent data, and budgets shift accordingly.
The third blind spot is brand. It’s the easiest line item to cut when a quarter gets tight, and the cut never shows consequences until performance channels quietly get more expensive months later.
My priority order for any team starting this work: fix the measurement foundation first, layer in incrementality testing second, and only then build out risk-adjusted capital allocation. Skipping straight to sophisticated allocation models on top of bad data just produces confident, wrong decisions faster. None of this works without quarterly governance and marketing and finance actually agreeing on what “return” means before the next budget cycle starts.
How Solution For guru Helps You Put This Into Practice
Most of what separates a real ROI improvement from another quarter of guesswork is infrastructure: clean event tracking, a dashboard that actually reconciles attribution against incrementality, and a budget model built around risk-adjusted returns instead of last quarter’s spreadsheet. That’s the work Solution For guru does with clients directly, not generic advice, but the analytics setup, MMM implementation, and conversion rate optimization that make the framework in this guide operational.

If your UTM structure is inconsistent, your CRM and ad platforms disagree on what counts as a conversion, or you’ve never run a real incrementality test, that’s the starting point, and Solution4guru builds it alongside your team rather than handing over a report you have to interpret. A free consultation covers where your current measurement stands and what a realistic implementation timeline looks like for your data volume. Start by reviewing the full measurement framework guide and booking a consultation to map your specific setup.
Sources
FAQ
ROAS measures revenue divided by ad spend using attribution data, while marketing ROI factors in total cost and often margin or CLTV. ROAS can look strong even when incremental impact is weak.
Run a holdout test or geo-experiment to isolate what revenue wouldn’t have happened without the spend, then apply the standard ROI formula using that incremental figure instead of attributed revenue.
Quick wins like UTM fixes and A/B tests show results in 2 to 8 weeks, while a full measurement foundation and capital-allocation rollout typically takes 3 to 6 months or more.
Yes, though the scale differs. Smaller teams can start with simplified confidence-interval tracking and directional reallocation before investing in full MMM tooling, and Solution4guru’s consulting scales the approach to match available data volume.