Understanding the Customer Journey: A Guide for Business Leaders

The customer journey is the complete sequence of interactions, decisions, and emotions a person experiences from first discovering your brand through purchase, ongoing use, support, and advocacy. Mapping it reveals exactly where friction costs you revenue and where small improvements produce measurable lifts in retention and lifetime value. The most productive first step: pick one journey, define its start and end points, and map it before touching anything else.
Table of Contents
- What the customer journey actually is — and what it isn’t
- What are the five stages of the customer journey?
- Why does understanding the journey pay off for your business?
- How do you map a customer journey in seven steps?
- What data sources and tools do you need for a reliable journey view?
- How do you measure whether journey improvements are working?
- What mistakes do teams most often make with journey mapping?
- How an agency builds a customer-360 and practical map
- Key Takeaways
- The part most teams get wrong about journey orchestration
- How Solution4guru helps you go from map to measurable result
- Useful sources for further reading
- FAQ
What the customer journey actually is — and what it isn’t
The term gets used loosely, so precision matters here. The customer journey covers the full lifecycle: awareness, acquisition, onboarding, active use, support interactions, renewal, and advocacy. It includes every channel, every emotion, and every decision point a customer encounters with your brand over time.
That is different from two related concepts teams often conflate:
- Buyer journey: purchase-focused, ending at the transaction. It maps how a prospect moves from problem recognition to vendor selection. Useful for sales and demand generation, but it stops at conversion and misses everything that drives long-term growth.
- Customer experience (CX): the broader organizational outcome — how customers perceive your brand across all interactions. CX is the result; the journey is the process that produces it.
| Term | Primary focus | Where it ends | Primary owner |
|---|---|---|---|
| Buyer journey | Purchase decision | Closed deal | Sales / demand gen |
| Customer journey | Full lifecycle | Advocacy or churn | Marketing, product, CS |
| Customer experience | Brand perception | Ongoing | CX / executive leadership |
Journeys are also rarely linear. A B2B prospect might read a case study, attend a webinar, go dark for six weeks, then re-engage through a paid search ad before booking a demo. A B2C shopper might discover a product on social media, abandon a cart, receive a re-engagement email, and convert via a loyalty offer. Both paths are valid journeys. Mapping them requires accounting for branching behavior, not just a tidy left-to-right funnel.
What are the five stages of the customer journey?
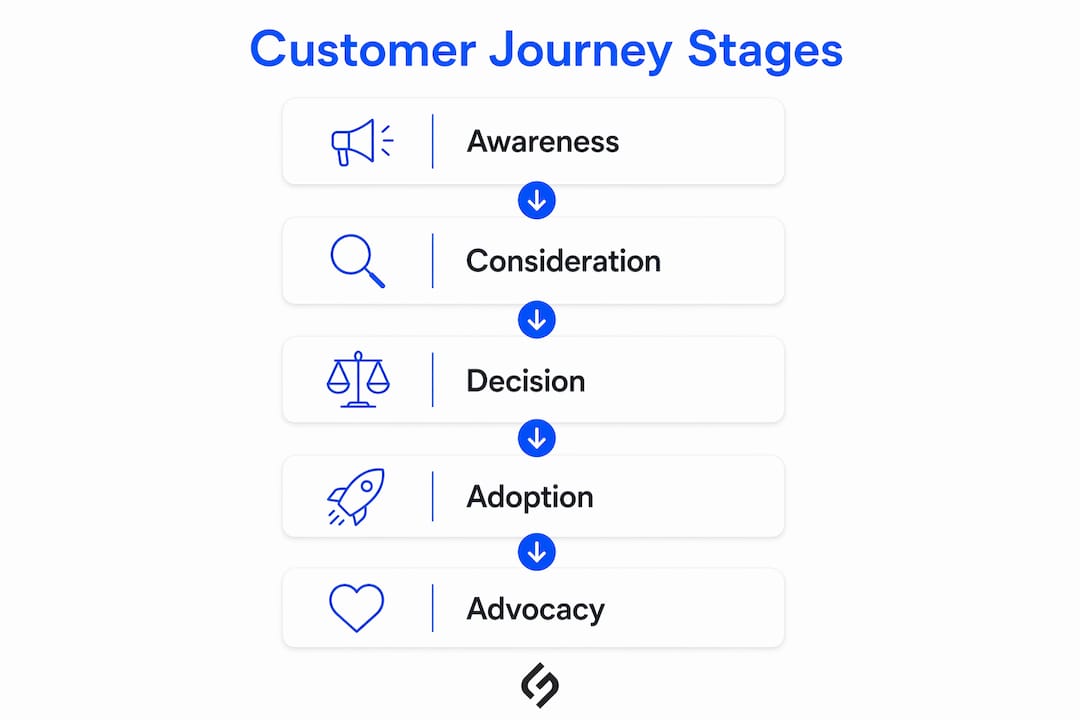
The most practical stage model for teams runs five phases. Each stage has distinct customer goals, representative touchpoints, and metrics worth tracking.
Awareness: The customer recognizes a problem or discovers your brand for the first time. Touchpoints include organic search, paid ads, social content, word of mouth, and trade publications. Track: branded search volume, impressions, and top-of-funnel traffic sources.
Consideration: The customer actively evaluates options. Touchpoints include product pages, comparison content, review sites (G2, Capterra), sales outreach, and demo requests. Track: engagement rate, demo conversion rate, and time-to-first-contact.
Decision: The customer chooses a vendor or product. Touchpoints include pricing pages, proposal reviews, legal/procurement, and final sales calls. Track: win rate, sales cycle length, and proposal-to-close ratio.
Adoption and retention: The customer onboards, activates, and builds habits around your product or service. This is where most churn risk lives. Touchpoints include onboarding emails, in-app guidance, support tickets, and customer success check-ins. Track: time-to-activation, feature adoption rate, support ticket volume, and churn rate.
Advocacy: Satisfied customers refer others, leave reviews, and expand their own accounts. Touchpoints include referral programs, NPS surveys, community forums, and upsell conversations. Track: NPS, referral rate, expansion revenue, and review volume.
Branching behavior shows up most between consideration and decision, and again between adoption and advocacy. A customer who skips the consideration stage entirely (direct referral) needs a different onboarding sequence than one who spent three months evaluating alternatives. Recognizing those branches is what separates a useful map from a decorative one.
Why does understanding the journey pay off for your business?

The business case for journey work is concrete. Behavior-triggered journeys — onboarding sequences, re-engagement flows, and qualification paths — consistently outperform time-based broadcast campaigns for both relevance and conversion. That shift from reactive campaign work to proactive lifecycle automation is where the measurable returns appear.
Specific benefits by function:
- Marketing: Identify which channels and messages drive high-value customers, not just volume. Reallocate acquisition spend toward paths that produce better LTV.
- Sales: Spot friction in the consideration-to-decision transition. Shorter sales cycles and higher win rates follow when sales plays match where the buyer actually is.
- Product: Surface adoption gaps early. If 40% of new users never reach a key activation milestone, that is a product problem, not a marketing problem.
- Support: Reduce ticket volume by fixing the touchpoints that generate the most confusion. Proactive support at the right moment costs less than reactive resolution.
Two concrete use cases illustrate the pattern. In B2B SaaS, a company maps its trial onboarding journey and discovers that users who complete three specific actions in the first 72 hours convert to paid at twice the rate of those who do not. The fix is a targeted in-app prompt sequence, not a pricing change. In B2C e-commerce, a brand maps its first-purchase retention journey and finds that customers who receive a personalized post-purchase email within 24 hours show significantly higher 90-day repeat purchase rates. Both fixes are small, targeted, and tied directly to a mapped moment of friction.
Marketing automation ROI compounds when these journey-specific flows replace generic broadcast campaigns, because each message is triggered by a real behavioral signal rather than a calendar date.
How do you map a customer journey in seven steps?
A repeatable mapping process keeps teams aligned and produces maps that are actually used. Here is a seven-step workflow:
Define the objective. Choose one journey to map and state what you want to improve. “Reduce churn in the first 90 days” is a workable objective. “Understand our customers better” is not. A clear objective determines which data to collect and what success looks like.
Select the persona. Pick one customer segment for this map. Use real data — firmographic, behavioral, and demographic — to define the persona’s goals, constraints, and typical entry point. A map built for “all customers” is a map built for no one.
Collect qualitative and quantitative data. Combine customer interviews, support transcripts, and survey responses with behavioral analytics, CRM records, and conversion data. Research-driven mapping surfaces friction points and unmet needs that assumptions consistently miss.
List every touchpoint. Document where the customer interacts with your brand at each stage: website visits, emails, ads, sales calls, in-app events, support contacts, billing interactions, and offline moments. Include touchpoints you do not control (review sites, social mentions).
Map emotions and outcomes. For each touchpoint, record what the customer is trying to accomplish, how they likely feel, and what friction or uncertainty they encounter. Distinguish explicit pain points (complaints, survey responses) from latent needs (surfaced through behavioral analysis).
Validate with behavioral data. A journey map is a hypothesis about a persona’s path, not a universal truth. Validate it against conversion rates, drop-off points, and session recordings. Adjust the map where behavior contradicts assumptions.
Prioritize fixes and build a roadmap. Identify the highest-impact friction points and score them on an impact-vs.-effort matrix. A touchpoint with high drop-off and a low-effort fix goes to the top of the backlog. Document the hypothesis, the proposed change, and the success metric before any work begins.
Pro Tip:
When scoring fixes, start with the touchpoint that has the largest measurable drop-off and the clearest behavioral signal. A hypothesis like “If we add an in-app checklist at day 3, time-to-activation will decrease by 20%” is testable. “Improve onboarding” is not.
What data sources and tools do you need for a reliable journey view?
Mapping without data produces a story, not a strategy. The core data sources to connect are:
- Website and app analytics (Google Analytics 4, Mixpanel, Amplitude) for behavioral event data
- CRM records (Salesforce, HubSpot) for deal history, contact attributes, and sales activity
- Marketing automation events (HubSpot, Klaviyo) for email engagement, lifecycle stage, and campaign response
- Support tickets (Zendesk, Intercom) for friction signals and resolution patterns
- Billing and subscription data for renewal, expansion, and churn signals
- Offline data: sales call recordings, in-store transactions, event attendance
The challenge is that these systems rarely talk to each other by default. Integrating fragmented data from website, sales, email, and support into a single unified view is the prerequisite for personalized engagement at scale. A Customer Data Platform (CDP) solves this by ingesting events from all sources, resolving identity across devices and sessions, and creating a single customer profile that any downstream tool can query. When your team needs to trigger a behavior-based email, personalize a web experience, or score a lead based on support history, a CDP reduces fragmentation and makes that orchestration possible without custom engineering for every integration.

Pro Tip:
Before building any attribution model, establish a consistent event taxonomy. Every team must use the same names for the same events — “trial_started” not “TrialStart” in one system and “trial_start” in another. Inconsistent naming is the single most common reason journey analysis breaks down.
| Tool category | Example tools | Primary role in journey work |
|---|---|---|
| Web / app analytics | Google Analytics 4, Mixpanel, Amplitude | Behavioral event capture and funnel analysis |
| CRM | Salesforce, HubSpot CRM | Contact records, deal history, sales activity |
| Marketing automation | HubSpot, Klaviyo | Lifecycle flows, email/SMS triggers, segmentation |
| CDP | Segment, mParticle | Identity resolution, unified profiles, data routing |
| Journey analytics | Adobe Customer Journey Analytics | Cross-channel attribution, cohort analysis |
| Support | Zendesk, Intercom | Friction signals, resolution data, CSAT |
For CRM integrations that connect these systems into a coherent view, governance basics matter as much as the technology: define data ownership per system, set a quarterly review cadence for event schemas, and document who can modify field definitions.
How do you measure whether journey improvements are working?
Measurement ties journey work to business outcomes. The key is matching the right KPI to the right stage rather than tracking everything everywhere.
| Stage | Primary KPIs | Recommended data source |
|---|---|---|
| Awareness | Impressions, branded search volume, traffic by channel | Google Analytics 4, Search Console |
| Consideration | Engagement rate, demo requests, MQL-to-SQL rate | CRM, marketing automation |
| Decision | Win rate, sales cycle length, proposal-to-close ratio | CRM (Salesforce, HubSpot) |
| Adoption / retention | Time-to-activation, feature adoption, churn rate | Product analytics, billing data |
| Advocacy | NPS, referral rate, expansion revenue | NPS tool, CRM |
Attribution is where most teams hit a wall. Single-touch models (first-click or last-click) misrepresent how journeys actually work. High-value conversions often involve 5–12 touchpoints across channels over weeks or months. Multi-touch attribution distributes credit across the full path; data-driven attribution uses statistical modeling to weight touchpoints by their actual contribution to conversion. Neither is perfect, but both are more accurate than last-click for journeys longer than a single session.
For experiment design: define the hypothesis and success metric before making any change, run tests long enough to reach statistical significance, and set an attribution window that matches the typical sales cycle. A 7-day attribution window on a 45-day B2B sales cycle will undercount conversions and produce misleading results.
What mistakes do teams most often make with journey mapping?
The most costly mistakes are structural, not tactical.
- Treating mapping as a one-time project. A map that reflects last year’s product and last year’s customer behavior is a liability. Top teams update maps quarterly and tie updates to product releases and observable analytics shifts.
- Focusing only on acquisition. Mapping the funnel to conversion and stopping there leaves expansion and advocacy revenue unmeasured and unmanaged.
- Building maps without validating with data. A map built on internal assumptions represents a “mythical” customer, not a real one. Validate every stage against actual drop-off and conversion data.
- Siloed KPIs across teams. When marketing measures MQLs, sales measures pipeline, and product measures DAUs with no shared definition of success, the map has no owner and no accountability.
- Ignoring post-purchase stages. The adoption and retention stage is where churn is won or lost. Skipping it means optimizing for acquisition while bleeding customers out the back.
Red flags that a map needs rework:
- Inconsistent event definitions across systems (the same action has different names in different tools)
- Large, unexplained drop-offs at touchpoints that should be low-friction (e.g., a confirmation page)
- No behavioral data backing any stage of the map
- The map has not been reviewed since the last major product change
When a red flag appears, the immediate action is to pull the raw behavioral data for that touchpoint, identify who owns it (marketing, product, or engineering), and schedule a working session within two weeks — not a committee review in six.
How an agency builds a customer-360 and practical map
A mid-sized B2B software company engaged Solution4guru to reduce 90-day churn, which had been climbing despite strong acquisition numbers. The objective was specific: identify the friction points between trial signup and first meaningful product use, then fix the highest-impact ones.
Scope and data sources stitched:
- CRM (Salesforce) for account attributes and sales activity history
- Product analytics (Mixpanel) for in-app event data and funnel analysis
- Marketing automation (HubSpot) for email engagement and lifecycle stage
- Support tickets (Zendesk) for early-stage friction signals
- Customer interviews (six sessions with recently churned users)
Steps taken:
- Established a consistent event taxonomy across Mixpanel and HubSpot before any analysis
- Built a unified customer view that connected CRM account data to product behavior and support history
- Mapped the trial-to-activation journey for the primary persona (mid-market ops manager)
- Identified a single high-drop-off moment: 58% of trial users never completed the third onboarding step, which was required to unlock the product’s core value
- Validated the finding against session recordings and support ticket themes
- Proposed and tested a redesigned in-app checklist with a contextual tooltip at step three
Measurable outcome: Trial-to-paid conversion improved materially within 60 days of the fix going live. The map itself became a shared artifact used by product, marketing, and customer success in quarterly planning.
Takeaways to replicate:
- Fix event taxonomy before building any attribution model
- Interview churned customers, not just active ones
- Map one persona and one journey at a time; breadth comes after depth
- Tie every proposed fix to a testable hypothesis with a named success metric
Key Takeaways
Effective customer journey work requires unified data, validated maps, and a governance cadence that keeps both current — not a one-time workshop.
| Point | Details |
|---|---|
| Map one journey first | Pick a single persona and a specific stage before expanding scope. |
| Validate with behavior | Check every stage assumption against real drop-off and conversion data. |
| Connect your data sources | Link CRM, analytics, marketing automation, and support before building attribution models. |
| Update maps quarterly | Tie map reviews to product releases and observed analytics shifts to keep them accurate. |
| Solution4guru accelerates this | Solution4guru provides CRM/CDP integration, journey mapping, and UX optimization to move teams from map to measurable result faster. |
The part most teams get wrong about journey orchestration
Most organizations treat customer journey mapping as a design exercise. They run a workshop, produce a colorful diagram, and file it in a shared drive. Six months later, nothing has changed, and the map is already out of date.
The teams that actually move metrics treat the map as an operational artifact, not a deliverable. They connect it to a live data layer, assign ownership to specific touchpoints, and review it on a fixed cadence. The difference is not the quality of the map. It is the governance structure around it.
There is also a persistent overemphasis on tooling. Teams spend months evaluating CDPs and attribution platforms before they have consistent event naming across two systems. The technology cannot fix a data quality problem. Governance and taxonomy come first; sophisticated tooling comes after.
The most underrated lever in journey work is executive alignment on a shared definition of success. When marketing, product, and customer success each optimize for their own stage-level metric with no shared outcome, the journey has no coherent owner. Getting leadership to agree on one north-star metric per journey, before the mapping work begins, is the fastest path to organizational action.
How Solution For guru helps you go from map to measurable result
Most teams know they need better journey visibility. The gap is between the map and the operational change that actually moves a metric. Solution4guru closes that gap directly: CRM and CDP integration, journey mapping workshops grounded in your real behavioral data, UX and onboarding optimization, and measurement infrastructure that ties changes to business outcomes.
The work is scoped to your specific situation, not a generic playbook. Whether the priority is reducing 90-day churn, improving trial-to-paid conversion, or building the data foundation for lifecycle automation, the engagement starts with a free consultation to identify the highest-impact journey to address first. Solution4guru’s UX design and journey optimization practice and core digital services are available to U.S. businesses ready to move from theory to implementation. Book a free consultation to define your first mapping objective and leave with a clear next step.
Useful sources for further reading
What Is a Customer Journey Map? Process, Stages, and Example — Harvard Business School Online. A rigorous, example-backed introduction to journey map components and the step-by-step mapping process. Read it for the T-Mobile case study and the framework for capturing emotions and pain points alongside touchpoints.
Customer Journey: Stages, Mapping & Free Template — Klaviyo. Practical guide oriented toward e-commerce and lifecycle email teams. Most useful for the five core journey types (prospect through VIP) and the free mapping template.
The Complete Guide to Customer Journey Marketing — Ortto. Covers behavior-triggered orchestration and the shift from campaign-based to lifecycle-based marketing. Read it for the CDP integration guidance and the argument for starting with a short set of high-impact journeys.
How to Analyze Customer Journeys Effectively — Cometly. Step-by-step guide to connecting ad platforms, website analytics, CRM, and offline events for attribution analysis. Most useful for the touchpoint-count data and the guidance on analyzing high-value customer paths over 60–90 days.
Customer Journey Map Guidance — Zendesk. Covers governance and the living-document approach to journey maps. Read it for the quarterly update cadence and the guidance on tying map reviews to product releases.
How to Conduct a Customer Journey Analysis — Matomo. Privacy-focused analytics perspective on journey analysis. Useful for teams that need server-side tracking guidance and want an alternative to Google Analytics 4 for behavioral data collection.
How CRM Helps Personalize Customer Journeys at Scale — Solution4guru. Explains how CRM platforms enable unified profiles and personalization across lifecycle stages. Read it for the practical integration patterns and the guidance on connecting CRM state to marketing triggers.
AI for Customer Insights: A Practical SMB Guide — Solution4guru. Covers how AI surfaces behavioral patterns and micro-conversions that manual analysis misses. Useful for teams building measurement infrastructure on top of a unified data layer.
FAQ
The customer journey covers the full lifecycle from awareness through advocacy, including post-purchase use, support, and retention. The buyer journey ends at the purchase decision and is focused on acquisition only.
The five stages are awareness, consideration, decision, adoption and retention, and advocacy. Each stage has distinct customer goals, representative touchpoints, and metrics to track.
The seven steps are: define the objective, select the persona, collect qualitative and quantitative data, list every touchpoint, map emotions and outcomes, validate with behavioral data, and prioritize fixes with a roadmap.
Connect your CRM, website analytics, marketing automation, and support data into a unified view, then validate each stage of the map against real drop-off and conversion data rather than internal assumptions.
How often should a customer journey map be updated?
Top-performing teams update maps quarterly, tying reviews to product releases and observable shifts in analytics. A map that has not been reviewed since the last major product change is likely misleading.