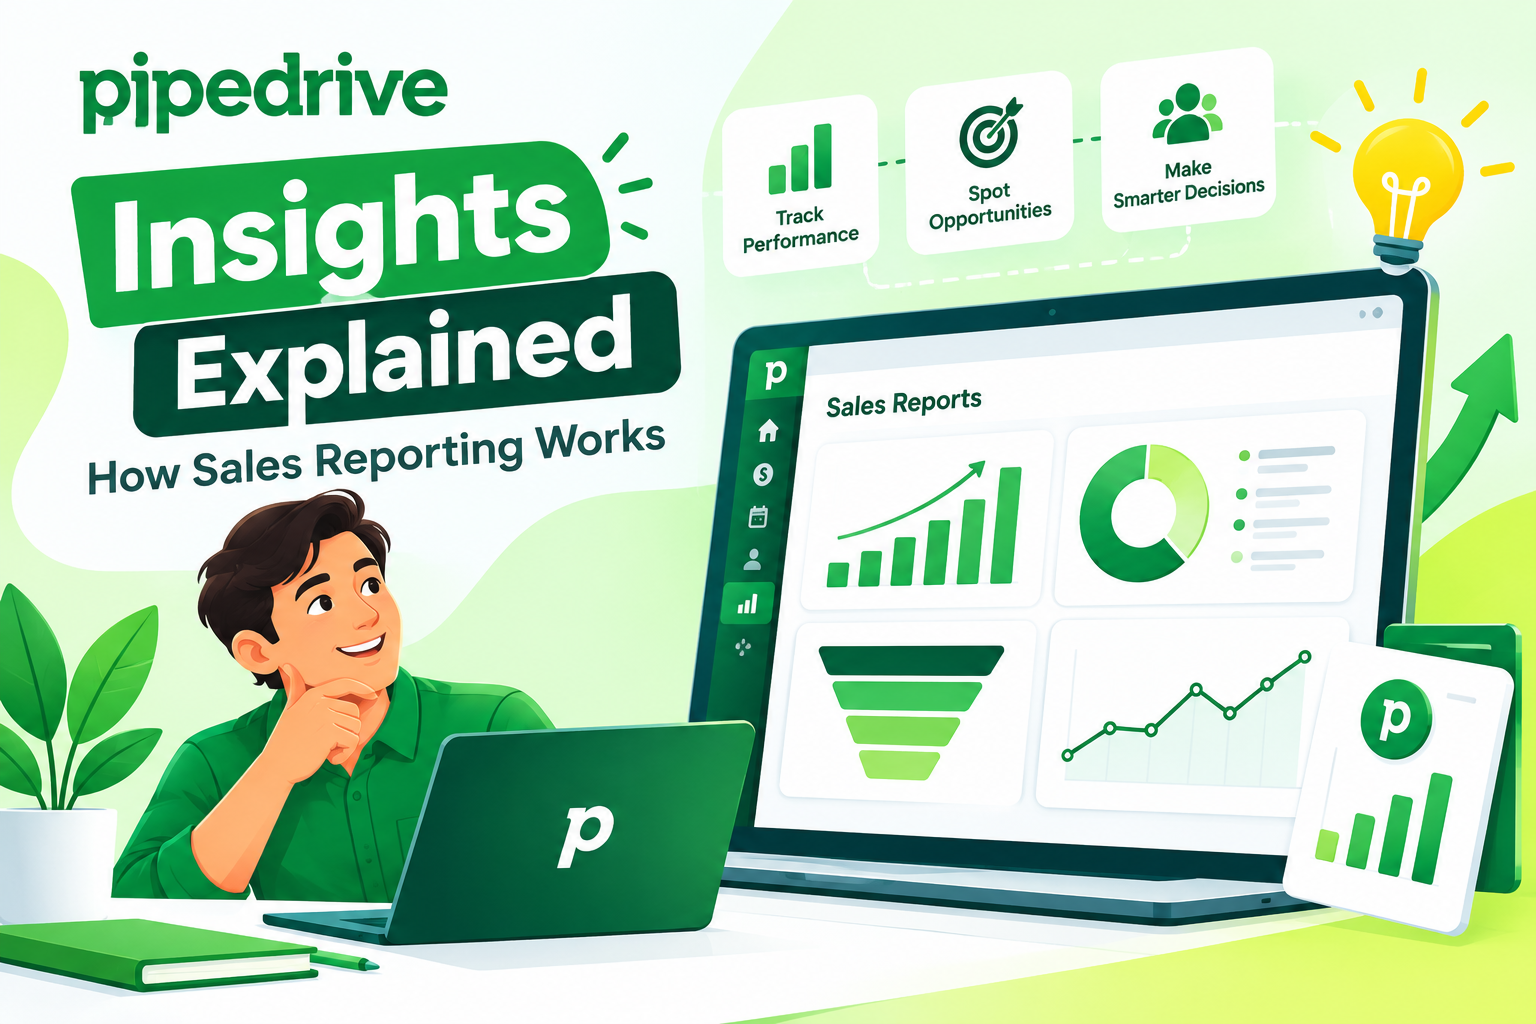
Best Pipedrive Reports for Sales Managers

Sales managers juggle dozens of numbers every week — pipeline value, win rates, activity counts, forecasts — and pulling all of that together manually eats hours that could go toward coaching the team. Fortunately, the right reporting setup turns that chaos into a clear, actionable picture.
This matters even more today, since sales cycles keep getting longer and buyers expect faster, more personalized responses. A manager who reviews outdated numbers reacts too slowly, while one who works from live data can step in exactly when a rep or a deal needs support. This article walks through the best Pipedrive reports for sales managers, explains what each one reveals, and shows how to combine them into dashboards that actually drive decisions.
Table of contents
What Will You Learn From This Quick Summary?
Before diving into the details, here is a quick snapshot of what this guide covers:
- Why sales managers need structured reporting instead of manual spreadsheets
- The most valuable Pipedrive reports, including Sales Performance, Deals, Activities, Forecast, Conversion, Goals, and Lost Reasons reports
- A comparison table showing what each report measures and who benefits most from it
- Step-by-step guidance for building a custom Pipedrive dashboard
- Best practices for using reports to coach reps and hit revenue targets
- How partnering with a certified Pipedrive expert like Solution For Guru can speed up implementation and unlock more value from the CRM
What Makes Pipedrive CRM the Right Tool for Sales Reporting?

Pipedrive CRM was built around the pipeline, so its reporting engine naturally reflects how deals move from first contact to closed-won. Instead of exporting data into external spreadsheets, managers can generate live reports directly inside the platform and drag them onto a dashboard in a few clicks.
According to Pipedrive’s own product documentation, the Insights section lets users build custom dashboards by selecting from a library of report types, then arranging them by size, position, and key metric. Because the reports pull from real-time CRM data, managers always see current numbers rather than a snapshot from last week’s spreadsheet export.
This real-time, visual approach matters because sales management is fundamentally about spotting problems early. A stalled deal, a rep falling behind on activities, or a pipeline that looks full but is actually low-probability — all of these show up faster in a well-built report than in a gut feeling. That is exactly why choosing the right combination of Pipedrive reports becomes a core skill for any sales manager.
Moreover, Pipedrive’s reporting layer is not limited to a single fixed view. Managers can filter by user, team, market segment, or custom field, which means the same underlying data can answer very different questions depending on who is asking. A regional director might filter by territory, while a team lead filters by individual rep — both working from the same trusted dataset instead of separate spreadsheets that inevitably drift out of sync with each other.
Why Do Sales Managers Need the Right Reports?

Sales management without reliable reporting often turns into guesswork. Managers end up relying on what reps tell them in weekly check-ins, which means bad news travels slowly and good coaching opportunities get missed.
What Problems Arise Without Proper Reporting?
Several recurring issues show up when teams skip structured reporting:
- Blind spots in the pipeline: Deals sit untouched for weeks, and nobody notices until the forecast slips.
- Uneven coaching: Without activity data, managers coach based on impressions rather than facts.
- Inaccurate forecasts: Revenue predictions become optimistic guesses instead of data-backed projections.
- Wasted time: Manually compiling numbers from multiple sources takes hours that could go toward selling or coaching.
Consequently, sales managers who adopt structured Pipedrive reporting typically catch problems earlier, coach more precisely, and forecast with far more confidence.
There is also a trust dimension to consider. When numbers come from a shared, live dashboard rather than individual spreadsheets, reps, managers, and executives stop debating whose numbers are correct and start discussing what to do about them. That shift alone often saves significant time in weekly and monthly sales meetings, since the conversation moves straight to action items instead of data reconciliation.
What Are the Best Pipedrive Reports for Sales Managers?

Pipedrive offers several report types, and each one answers a different management question. The sections below break down the reports that matter most for day-to-day sales leadership.
How Does the Sales Performance Report Help Managers?
The Sales Performance report gives an at-a-glance view of how the whole team — or an individual rep — is doing against targets. It typically surfaces metrics such as deals won, total revenue, average deal size, and win rate over a chosen period.
Because this report can be filtered by user, team, or time range, managers can quickly compare performance across regions or spot which reps consistently exceed quota. Furthermore, since the data updates automatically, there is no need to wait for a weekly export before a one-on-one meeting.
Many managers also use this report to identify mentoring pairs. For example, a rep who struggles with deal size might benefit from shadowing a colleague who consistently closes larger contracts, and the Sales Performance report makes that gap immediately visible rather than anecdotal.
How Does the Deals Report Track Pipeline Health?
The Deals report focuses on what is currently open rather than what has already closed. It shows deal value, stage, probability, age, and ownership across the entire pipeline.
One particularly useful feature is the “rotten days” indicator, which flags deals that have not moved forward within an expected timeframe. This helps managers prioritize follow-up conversations before a promising opportunity quietly dies in the pipeline. As a result, the Deals report becomes the go-to source for weekly pipeline review meetings.
Beyond flagging stalled deals, this report also helps managers judge whether the pipeline is genuinely healthy or simply large. A pipeline full of early-stage, low-probability deals looks impressive on paper but rarely converts into predictable revenue, so pairing deal count with stage and probability data gives a far more honest picture.
How Does the Activities Report Reveal Team Effort?
Results matter, but activity drives results. The Activities report tracks calls, emails, meetings, and tasks completed by each rep, making it possible to see whether low performance stems from low effort or from something else, such as poor lead quality.
Additionally, this report helps managers identify coaching opportunities. For example, a rep who logs plenty of activity but closes few deals might need help with qualification or closing technique, rather than a push to simply “do more.”
On the other hand, a rep with strong close rates but low logged activity might simply be underreporting their work in the CRM, which is a data-hygiene issue rather than a performance issue. Either way, the Activities report gives managers a factual starting point instead of relying on assumptions during a coaching conversation.
How Does the Forecast Report Support Revenue Planning?
The Forecast report combines deal value with probability ratings and historical closure patterns to predict revenue for upcoming periods. Rather than relying on a rep’s optimistic estimate, this report weighs each open deal according to how likely it is to close.
Because of this probability weighting, sales managers gain a more realistic view of what revenue to expect next month or next quarter, which in turn supports better resource planning and more credible conversations with leadership.
Over time, comparing forecasted numbers against actual closed revenue also reveals whether a team consistently overestimates or underestimates its pipeline. Recognizing that pattern early lets managers adjust probability assumptions and set more accurate expectations for the next planning cycle.
How Does the Conversion or Funnel Report Show Pipeline Efficiency?
The Conversion report — sometimes called the Funnel report — tracks how deals move (or fail to move) from one pipeline stage to the next. It reveals conversion rates at each stage, which highlights exactly where deals get stuck.
For instance, if a large share of deals drop off between “Proposal Sent” and “Negotiation,” that signals a pricing, messaging, or follow-up problem worth investigating. Consequently, this report often becomes the starting point for process improvements rather than individual coaching.
Sales managers can also use the Conversion report to benchmark different lead sources or campaigns. If leads from one channel convert at a noticeably higher rate than others, that insight can shift budget and effort toward the sources that actually produce revenue, rather than the ones that simply generate volume.
How Does the Goals Report Track Team and Individual Targets?
The Goals report lets managers set targets for revenue, activities, or deals won, then track progress in real time. Because goals can be assigned to individuals or entire teams, this report works well for companies managing multiple regions or divisions.
Visual progress bars and traffic-light indicators make it easy to spot who is on pace and who needs support before the end of the period, rather than discovering the shortfall after it is too late to react.
This report also works well for keeping international or multi-office teams aligned, since managers can compare goal pacing across regions and quickly see whether a shortfall is isolated to one market or reflects a broader trend across the entire organization.
How Does the Lost Reasons Report Improve Win Rates?
Every closed-lost deal carries a lesson, and the Lost Reasons report collects those lessons in one place. It breaks down lost deals by reason, competitor, stage, and rep, which makes patterns easy to spot.
If, for example, “price too high” appears repeatedly against one competitor, that is a clear signal for the sales and product teams to revisit positioning or packaging. Over time, this report helps convert losses into a genuine competitive advantage.
It also gives sales managers useful evidence to bring into cross-departmental conversations. Sharing concrete loss data with product or marketing teams tends to carry far more weight than a vague comment that “we keep losing to competitors,” since the report points to specific stages, reasons, and rivals behind the pattern.
Which Pipedrive Report Should You Use for Each Management Task?
The table below summarizes the reports discussed above so managers can quickly match a business question to the right report.
| Report | What It Shows | Best Used For |
|---|---|---|
| Sales Performance | Revenue, win rate, deals won, average deal size | Reviewing overall or individual rep performance |
| Deals | Open pipeline value, stage, age, probability | Weekly pipeline reviews and spotting stalled deals |
| Activities | Calls, emails, meetings, tasks completed | Coaching on effort and daily discipline |
| Forecast | Probability-weighted future revenue | Planning resources and setting expectations with leadership |
| Conversion / Funnel | Stage-to-stage conversion rates | Diagnosing where the sales process leaks deals |
| Goals | Progress against targets by rep or team | Tracking quota attainment in real time |
| Lost Reasons | Reasons deals were lost, by competitor and stage | Improving win rates and refining messaging |
How Can Sales Managers Build Custom Dashboards in Pipedrive?
Individual reports are useful, but dashboards let managers see everything at once. Pipedrive allows users to combine multiple reports into a single view, and higher-tier plans support several dashboards plus dashboard sharing across teams.
What Steps Are Needed to Create a Dashboard?
Building a dashboard generally follows this sequence:
- Open the Insights section from the main navigation menu.
- Select Dashboards, then choose to create a new one.
- Drag the desired reports from the Reports sidebar onto the dashboard canvas.
- Resize and reposition each widget so the most important metrics stand out first.
- Use the drop-down filters to switch between users, teams, or time periods without rebuilding the dashboard.
- Share the finished dashboard with relevant stakeholders, such as team leads or executives.
Because this process takes only a few minutes, managers can create separate dashboards for different purposes — one for daily pipeline checks, another for monthly performance reviews, and another for quarterly forecasting conversations.
It also pays to think about the audience before building each dashboard. A dashboard meant for daily use by a frontline manager should stay focused on a handful of actionable metrics, such as stalled deals and today’s activities, while a dashboard built for executives can afford to show broader trends like quarterly revenue and team-wide goal pacing. Trying to serve both audiences with one crowded dashboard usually satisfies neither.
What Mistakes Should Sales Managers Avoid When Reading Pipedrive Reports?

Even with great reports available, managers can still misread the data if they are not careful. A few recurring mistakes tend to undermine otherwise solid reporting habits.
Why Does Chasing Vanity Metrics Backfire?
It is tempting to celebrate a large pipeline value or a high activity count, but neither guarantees revenue. A pipeline stuffed with unqualified leads looks encouraging on a dashboard while actually hiding a conversion problem. Similarly, a rep who logs many calls but few meaningful conversations is not necessarily productive. Therefore, managers should always pair volume metrics with quality metrics, such as conversion rate or average deal size, before drawing conclusions.
Why Is Comparing Reps Without Context a Problem?
Two reps working different territories, industries, or lead sources rarely compete on a level playing field. A manager who ranks reps purely by revenue, without adjusting for territory difficulty or lead quality, risks demotivating strong performers stuck with harder accounts. Filtering reports by relevant segments, rather than looking only at raw totals, produces a fairer and more useful comparison.
Why Does Outdated Data Undermine Good Decisions?
Reports are only as reliable as the data entered into the CRM. If reps skip logging activities or forget to update deal stages, even the best-designed dashboard will mislead rather than inform. Building a habit of regular CRM hygiene checks, and holding the team accountable for keeping records current, protects the accuracy of every report built on top of that data.
What Best Practices Help Sales Managers Get More From Pipedrive Reports?

Having access to reports is only half the battle; using them consistently makes the real difference. A few habits help teams get the most value:
- Review the Deals report weekly to catch stalled opportunities before they go cold.
- Pair Activities data with Sales Performance data so effort and outcomes are discussed together, not separately.
- Set realistic Goals based on historical Forecast accuracy rather than aspirational numbers alone.
- Revisit Lost Reasons every quarter to see whether messaging or pricing adjustments actually reduced losses.
- Limit each dashboard to the metrics that matter for its audience, since overcrowded dashboards make it harder to spot what needs attention.
Ultimately, reports only create value when they inform a decision or a conversation. Therefore, building a habit around reviewing them regularly matters just as much as choosing the right reports in the first place. Sales managers who block dedicated time each week for report review, rather than glancing at numbers only when something goes wrong, tend to catch small issues while they are still easy to fix.
It also helps to involve the wider team in this process. When reps understand which numbers their manager watches and why, they naturally start paying closer attention to their own activity, pipeline hygiene, and follow-up timing. In this way, reporting stops being something managers do to the team and instead becomes a shared language for talking about performance.
Team size also shapes which reports deserve the most attention. Smaller teams often get the most value from a lean setup — typically the Deals, Activities, and Sales Performance reports — since a handful of reps can be tracked closely without heavy dashboard segmentation. Larger or multi-region teams, by contrast, tend to lean more heavily on Goals, Forecast, and Conversion reports to manage complexity across territories, products, or business units.
Conclusion: Why Are Pipedrive Reports Essential for Sales Managers?
Sales managers who rely on gut feeling and scattered spreadsheets eventually fall behind those who use structured, real-time reporting. Pipedrive brings together performance, pipeline, activity, forecast, and loss data into one connected system, which means managers no longer have to guess where a deal — or a rep — actually stands.
By combining the Sales Performance, Deals, Activities, Forecast, Conversion, Goals, and Lost Reasons reports into thoughtfully built dashboards, sales managers gain a clear, current view of the entire sales operation. Instead of chasing numbers across scattered spreadsheets, they can open a single dashboard and immediately see where to focus their attention next.
And when a team wants to get the most out of that setup without a lengthy learning curve, working with a partner such as Solution For Guru helps configure Pipedrive properly from day one, avoiding the common setup mistakes that quietly undermine reporting accuracy. Altogether, Pipedrive proves itself as one of the most practical CRM platforms for sales managers who want decisions backed by real data rather than assumptions, and a well-tuned reporting setup is what turns that potential into everyday results.
Frequently Asked Questions
Most new sales managers benefit most from the Deals report first, since it shows exactly what is happening across the current pipeline, including stalled deals that need immediate attention. Once pipeline visibility is established, adding the Sales Performance and Forecast reports rounds out a solid reporting foundation, giving a new manager a complete picture within the first few weeks on the job rather than months of trial and error.
Yes. Pipedrive lets users choose from a library of reports and drag only the relevant ones onto a dashboard. Managers can also resize widgets, apply filters for specific users or time periods, and build multiple dashboards for different purposes, such as daily pipeline checks versus quarterly forecast reviews. On most plans, dashboards can also be shared with other team members, so everyone works from the same live view instead of requesting individual exports.
Pipeline-focused reports, such as Deals and Activities, work best when reviewed weekly, since problems like stalled deals or low activity levels need quick attention. Forecast and Goals reports, on the other hand, are typically reviewed monthly or quarterly to support broader planning conversations with leadership. Lost Reasons reports fit naturally into quarterly business reviews, where there is enough time to spot meaningful patterns rather than reacting to a single lost deal.
Why Should Sales Managers Partner With Solution For Guru for Pipedrive Reporting?
Setting up Pipedrive reports correctly takes more than clicking around the Insights tab. Field mapping, pipeline stage definitions, and goal structures all need to be configured properly before the reports reflect reality. This is where working with a specialized partner like Solution For Guru makes a measurable difference.
Cooperating with Solution For Guru offers several concrete benefits:
- Faster, cleaner setup: Experienced consultants configure pipelines, custom fields, and dashboards correctly the first time, avoiding the trial-and-error that wastes weeks of internal effort.
- Reports built around real business goals: Rather than using default templates, Solution For Guru tailors reports and dashboards to the specific KPIs a sales team actually needs to track.
- Ongoing optimization: As a sales process evolves, Solution For Guru helps adjust pipelines and reports so reporting never becomes outdated or misleading.
- Training and adoption support: A dashboard only helps if the team actually uses it, so proper onboarding and training ensure reps and managers alike get comfortable with the new reporting habits.
- Integration expertise: Solution For Guru can connect Pipedrive with other business tools, ensuring reporting data stays consistent across marketing, finance, and sales systems.
In short, partnering with a Pipedrive specialist turns a good CRM into a genuinely powerful management tool, rather than a database that simply stores contact information. For growing sales teams, that difference often determines whether Pipedrive becomes a central part of daily decision-making or just another underused piece of software.
Many sales organizations also underestimate how much time internal teams spend troubleshooting CRM configuration issues on their own. Working with Solution For Guru shifts that burden to specialists who already know Pipedrive’s reporting engine in depth, which frees the sales manager to focus on coaching reps and closing deals rather than debugging dashboard filters.
Recommended:
- Pipedrive Insights Explained: How Sales Reporting Works
- Pipedrive Automation Examples for Sales Teams
- Pipedrive Sales KPIs: 15 Metrics Every Team Should Track
- How Pipedrive AI Helps Sales Teams Save Time
- CRM Roles 101: From CRM Administrator to CRM Developer
- Pipedrive MCP Explained: How AI Assistants Connect to Your CRM
- Sales Forecasting and Pipeline Management in Creatio CRM
- Pipedrive Sales Dashboard: How to Track Performance
- Pipedrive Automation Triggers and Actions Explained
- Pipedrive AI vs Traditional CRM Automation: What’s the Difference?
- ERP and ITSM Integration: Improving Operational Visibility Across Departments
- Integrating Endpoint Management Tools with Freshservice
- ManageEngine Asset Management (ITAM): Why Businesses Trust It to Control Their IT Assets
- Why Mid-Sized Companies Choose Freshservice Over Enterprise ITSM Platforms
- Best Reporting and Analytics Dashboards for IT Operations Teams in Freshservice
- How ITSM Platforms Support IT Compliance and Audit Readiness
- How ITSM Tools Support Internal IT Risk Management
- How AI Is Changing ITSM Workflows in Freshservice?