Pipedrive Insights Explained: How Sales Reporting Works
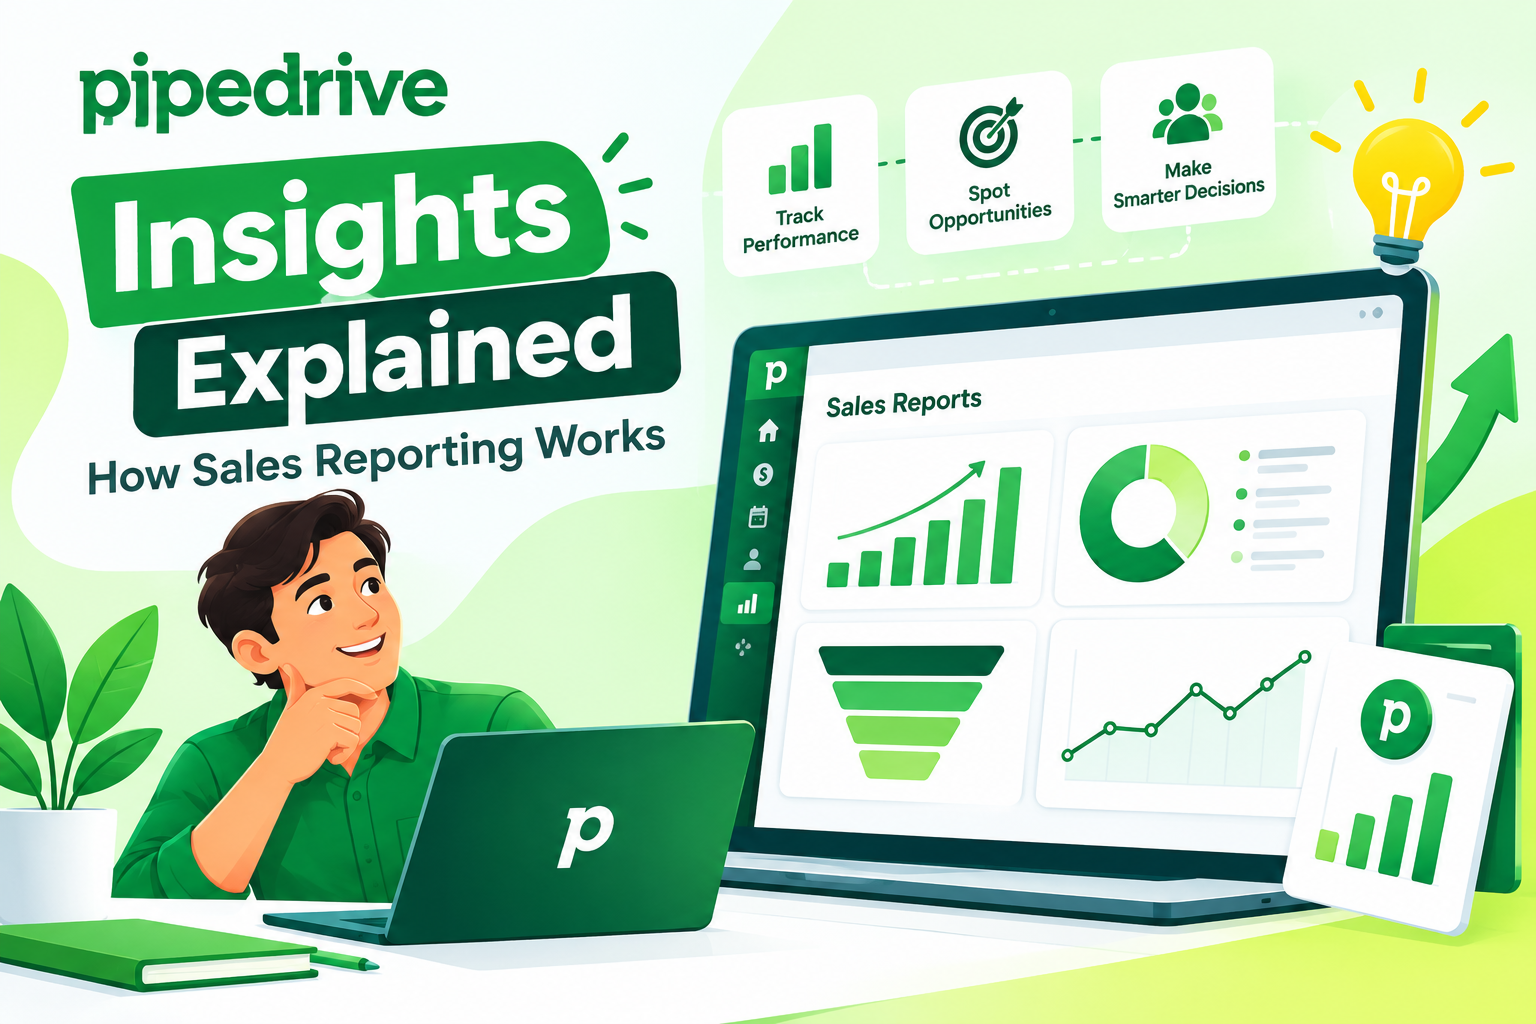
Sales teams generate mountains of data every single day, yet many managers still struggle to turn that data into clear answers. Which reps are closing deals fastest? Where do prospects stall in the pipeline? Is the team on track to hit quarterly targets? Fortunately, modern CRM platforms solve this problem by turning raw activity into visual, actionable reports. This article explains how Pipedrive Insights works, what it can do for your sales process, and how to get the most value from it.
Table of contents
Quick Summary
Before diving into the details, here is a snapshot of what this guide covers:
- What Pipedrive Insights is and how it fits inside the broader Pipedrive CRM platform
- How the reporting engine works, from dashboards to AI-generated reports
- The main report types available, including deal, activity, and forecast reports
- Practical ways sales teams use Insights to boost performance
- Best practices for building reports that actually drive decisions
- Why partnering with an implementation specialist, such as Solution For Guru, accelerates results
Now, let’s look at where Pipedrive Insights fits inside the bigger picture.
What Is Pipedrive CRM, and How Does It Reveal the Value of Sales Reporting?

Pipedrive CRM is a customer relationship management platform built specifically around the sales pipeline. Instead of burying deals inside spreadsheets or generic databases, Pipedrive visualizes every opportunity as a card moving through stages, from first contact to closed deal. Consequently, sales reps always know exactly where each prospect stands, and managers can spot bottlenecks before they become lost revenue.
However, tracking deals visually is only half the story. Underneath that visual pipeline sits a robust reporting engine called Insights. This module gathers activity data, deal history, and custom fields, then converts them into charts, tables, and dashboards. As a result, Pipedrive users do not just manage deals; they also measure and improve the process behind those deals.
Because Pipedrive was designed for small and mid-sized sales teams, its reporting tools stay approachable. Unlike enterprise business intelligence software, Insights does not require a data analyst to configure. Instead, sales managers can filter, group, and visualize their own data in a few clicks. That accessibility is precisely why this article focuses on Insights: it represents the point where Pipedrive’s simplicity meets serious reporting power.
What Is Pipedrive Insights, Exactly?
Pipedrive Insights is the analytics and reporting layer built directly into the CRM. Rather than exporting data to an external tool, users build reports and dashboards inside Pipedrive itself, using the same deals, activities, and contacts already stored in the system.
What Problem Does Insights Solve?
Sales managers often waste hours each week pulling numbers into spreadsheets, only to discover the data is already outdated by the time a report is finished. Insights removes that lag entirely. Because it pulls live data straight from the pipeline, every report and dashboard updates automatically as deals move, calls get logged, and emails get sent. Therefore, decisions rely on current information rather than last week’s snapshot.
Who Uses Insights Inside a Sales Team?
Different roles rely on Insights for different reasons:
| Role | Primary Use of Insights |
|---|---|
| Sales rep | Track personal quota progress and activity goals |
| Sales manager | Monitor team performance and identify coaching opportunities |
| Sales director | Forecast revenue and spot pipeline-wide bottlenecks |
| Marketing lead | Measure lead-to-deal conversion and campaign ROI |
| Founder/owner | Get a bird’s-eye view of overall business health |
Since each role needs a different lens on the same data, Insights allows every report to be filtered, grouped, and customized independently.
How Does Pipedrive Insights Compare to Manual Spreadsheet Reporting?
Many sales teams still rely on spreadsheets before switching to a dedicated reporting tool, so it helps to understand exactly what changes once Insights takes over that job.
Why Do Spreadsheets Fall Short for Sales Reporting?
Spreadsheets require someone to manually export data, clean it, and rebuild formulas every time a report needs updating. Because that process takes time, reports often reflect numbers that are days or even weeks old by the time leadership reviews them. Moreover, formulas break easily when new rows get added incorrectly, and version control becomes messy once multiple people start editing the same file.
How Does Insights Remove These Pain Points?
Since Insights connects directly to live CRM data, there is no export-and-rebuild cycle at all. Reports update the moment a deal changes stage or an activity gets logged, and every teammate views the same live numbers rather than a static copy. Additionally, because report logic lives inside Pipedrive rather than fragile spreadsheet formulas, reports remain stable even as the sales team grows or the pipeline structure changes.
What Trade-Offs Should Teams Expect?
That said, Insights is not a full replacement for every analytical need. Highly complex, cross-departmental analysis, such as blending sales data with detailed financial modeling, may still require exporting Pipedrive data into a dedicated business intelligence tool. Even so, for day-to-day sales performance tracking, Insights covers the vast majority of what a growing sales team needs without extra software.
How Does Pipedrive Insights Actually Work?
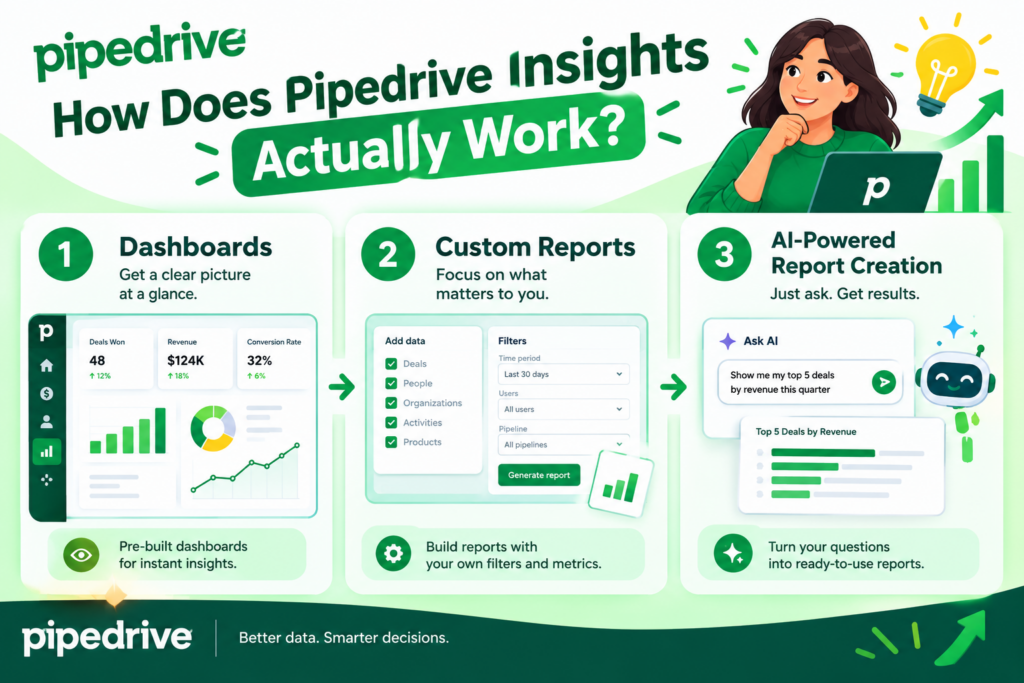
Understanding the mechanics behind Insights makes it easier to build reports that answer real business questions. Broadly, the feature operates through three connected components: dashboards, custom reports, and, more recently, AI-assisted report generation.
How Do Pipedrive Dashboards Work?
A dashboard functions as a collection of visual widgets, each representing a specific metric or report. Users can drag and drop these widgets onto a single screen, resize them, and rearrange the layout to match their priorities. For instance, a manager might place a “deals won this month” chart next to an “average deal value” widget and a “calls per rep” table, all on one screen.
Because dashboards refresh automatically, they work well as a always-on control center. Many teams display dashboards on office screens or open them each morning during stand-up meetings, since the visuals communicate performance far faster than raw numbers ever could.
How Do Custom Reports Work?
While dashboards show a summary view, custom reports dig deeper into a single question. Users select a data source, such as deals or activities, then choose measures like count, value, or duration. After that, they apply filters (for example, “only deals created in Q3” or “only deals owned by the East Coast team”) and grouping options (by rep, by stage, by product, or by time period).
The resulting report can be displayed as a bar chart, line chart, pie chart, or simple table, depending on which format communicates the answer most clearly. Once built, reports can be saved, shared with teammates, or pinned to a dashboard for ongoing monitoring.
How Does AI-Powered Report Creation Work?
Pipedrive has also introduced an AI-assisted reporting option within Insights. Instead of manually configuring filters and groupings, users type a plain-language request, such as “show me win rates by rep for the last quarter,” and the system generates a matching report automatically. For teams unfamiliar with data tools, this feature removes much of the setup friction and speeds up the path from question to answer.
What Types of Reports Can You Build in Pipedrive Insights?
Pipedrive Insights supports several report categories, each addressing a different stage of the sales process. The table below summarizes the most common types and what they reveal.
| Report Type | What It Measures | Best For |
|---|---|---|
| Deal reports | Number, value, and status of deals | Tracking pipeline health |
| Activity reports | Calls, emails, meetings logged per rep | Measuring effort and workload |
| Conversion reports | Percentage of deals moving between stages | Spotting pipeline bottlenecks |
| Revenue forecast reports | Projected income based on deal probability | Planning budgets and quotas |
| Progress reports | Performance against goals over time | Tracking quota attainment |
| Duration reports | Time spent in each pipeline stage | Identifying slow stages |
Because these reports pull from the same underlying data, teams can combine several report types on one dashboard to build a complete performance narrative, rather than viewing each metric in isolation.
How Can Sales Teams Use Insights to Improve Performance?

Building reports is only useful if the resulting insight changes behavior. Below are four common ways sales organizations translate Insights data into better outcomes.
How Do Teams Track Individual and Team Performance?
Managers frequently compare reps side by side using metrics such as calls made, deals won, and average deal size. This comparison highlights which behaviors correlate with success. For example, if the top-performing rep makes noticeably more follow-up calls than peers, that pattern becomes a coaching point for the rest of the team.
How Do Teams Forecast Revenue More Accurately?
Because Pipedrive assigns probability values to deals based on stage and historical win rates, revenue forecast reports weigh pipeline value accordingly rather than treating every open deal as guaranteed income. This weighted approach gives leadership a more realistic projection weeks before the quarter closes, leaving time to adjust strategy if the forecast falls short of target.
How Do Teams Spot Pipeline Bottlenecks?
Conversion and duration reports reveal exactly where deals slow down. If a large share of opportunities stall at the proposal stage, that signals a process issue, perhaps pricing objections or slow follow-up, worth investigating immediately. Addressing the bottleneck at its source often improves close rates more than adding new leads at the top of the funnel.
How Do Teams Align Activities With Outcomes?
Activity insights connect effort to results. Rather than simply counting calls or emails sent, teams can compare activity volume against deals won to see which actions actually drive revenue. Consequently, reps spend more time on high-impact activities and less time on tasks that rarely convert.
Which Pipedrive Insights Metrics Matter Most at Each Company Stage?
Not every business needs the same reports on day one. As a company grows, the metrics worth tracking inside Insights tend to shift accordingly.
What Should Early-Stage Sales Teams Track First?
Small or newly formed sales teams typically benefit most from tracking basic activity and pipeline volume: how many new deals enter the pipeline each week, and how many activities each rep logs. These simple numbers establish a baseline before more advanced analysis becomes useful.
What Should Growing Teams Add Next?
As a sales team expands past a handful of reps, conversion rates by stage and average deal size become more valuable, since they reveal where the growing team’s process needs tightening before scaling further. At this stage, comparing performance across reps also starts to matter, since it becomes easier to identify who could benefit from additional coaching.
What Should Mature Sales Organizations Prioritize?
Established sales organizations with historical data can lean more heavily on forecasting, quota tracking, and trend analysis across quarters or years. At this stage, Insights reports often inform strategic planning decisions, such as territory realignment or hiring, rather than just day-to-day coaching.
What Common Mistakes Should Teams Avoid When Using Pipedrive Insights?
Even a powerful reporting tool can produce misleading conclusions if it’s used carelessly. Watching out for a few common mistakes helps teams trust the numbers they see.
What Happens When Data Entry Is Inconsistent?
If some reps log every call while others skip logging altogether, activity reports end up comparing apples to oranges rather than reflecting true effort levels. Consequently, a rep who diligently logs every interaction may appear less productive than a colleague who simply works less but logs more, even though the opposite is true. Establishing a shared logging standard across the team prevents this distortion.
Why Is Tracking Too Many Metrics at Once a Problem?
Dashboards crowded with a dozen widgets often overwhelm rather than clarify. Instead of scanning quickly for a red flag, viewers get lost trying to decide which number matters most. A cleaner approach limits each dashboard to the handful of metrics tied directly to current business priorities, adding more only when a specific question arises.
What Risk Comes From Ignoring Report Context?
Numbers rarely tell the full story on their own. A dip in deals won during a particular month might reflect a genuine performance problem, or it might simply reflect a seasonal slowdown that happens every year. Therefore, pairing every report review with a short conversation about context prevents managers from reacting to noise instead of a real trend.
Why Shouldn’t Forecasts Be Treated as Guaranteed Outcomes?
Even weighted, probability-based forecasts represent an educated estimate rather than a certainty. Deals can fall through unexpectedly, so leadership should treat forecast reports as a planning tool that gets more accurate closer to the end of a sales cycle, rather than as a fixed promise of revenue.
What Are the Benefits of Using Pipedrive Insights?

Sales leaders who adopt Insights consistently report several recurring advantages:
- Faster decision-making, since data updates in real time rather than requiring manual exports
- Greater accountability, because performance metrics are visible to the whole team
- Improved forecasting accuracy, thanks to probability-weighted revenue projections
- Reduced administrative workload, as reports no longer need to be rebuilt manually each week
- Better coaching conversations, since managers can point to specific data rather than general impressions
- Clearer alignment between sales, marketing, and leadership around shared metrics
Taken together, these benefits shift reporting from a once-a-month chore into an everyday management habit.
How Does Pipedrive Insights Integrate With the Rest of the Sales Tech Stack?
Reporting rarely happens in isolation, since sales teams typically rely on several tools working together. Understanding how Insights fits alongside those tools helps businesses get a fuller picture of performance.
How Do Marketing Tools Feed Data Into Insights?
When marketing platforms sync with Pipedrive through native integrations or third-party connectors, lead source information flows directly into deal records. As a result, Insights reports can break down conversion rates by campaign or channel, showing which marketing efforts actually generate closed revenue rather than just website traffic.
How Do Communication Tools Enhance Activity Reporting?
Email and calling tools that integrate with Pipedrive automatically log activities against the correct deal or contact. Because that data flows in without manual entry, activity reports stay far more accurate than they would if reps had to log every call by hand. Consequently, managers get a truer picture of effort levels across the team.
How Do Finance and Accounting Tools Extend Reporting Value?
Some businesses connect Pipedrive to accounting software so that closed-deal data lines up with actual invoicing and payment records. This connection allows revenue forecasts built inside Insights to be checked against real collected revenue, closing the loop between sales projections and financial outcomes.
What Are the Best Practices for Getting the Most Out of Pipedrive Insights?

Getting real value from any reporting tool requires more than switching it on. The following practices help sales teams build reports that actually influence decisions.
How Should You Choose Which Metrics to Track?
Rather than tracking every available metric, focus on the two or three numbers that most directly reflect business goals, for example, win rate, average deal size, and sales cycle length. Too many metrics dilute attention and make dashboards harder to read at a glance.
How Often Should Reports Be Reviewed?
Weekly reviews work well for most sales teams, since they catch problems early without creating reporting fatigue. Monthly reviews suit revenue forecasting and quota tracking, while daily glances at a dashboard help reps stay motivated throughout the day.
How Should Teams Keep Data Clean for Accurate Reporting?
Reports are only as reliable as the underlying data. Consequently, teams should establish clear rules for logging activities, updating deal stages promptly, and filling in custom fields consistently. A simple data-entry checklist, reviewed during onboarding, prevents small inconsistencies from skewing reports later.
How Should Reports Be Shared Across the Organization?
Rather than emailing static screenshots, share live dashboard links so stakeholders always see current numbers. Additionally, pairing each shared report with a short written summary helps non-sales colleagues, such as marketing or finance, interpret the data correctly.
How Should Teams Set Realistic Goals Inside Insights?
Goal tracking works best when targets are broken down into achievable increments rather than a single large annual number. For example, instead of setting one goal of closing 200 deals per year, breaking that figure into monthly or weekly targets makes progress easier to monitor and gives reps more frequent moments of accomplishment along the way.
How Should New Sales Reps Be Onboarded Onto Insights?
New hires benefit from a short walkthrough of the dashboards they’ll use daily, rather than being left to explore the reporting module alone. Pairing that walkthrough with a simple reference sheet explaining what each metric means and why it matters helps new reps start contributing to healthy data habits from their very first week.
Conclusion: What’s the Bottom Line on Pipedrive Insights?
Pipedrive Insights transforms everyday CRM activity into visual, actionable reporting without requiring a dedicated analyst or external software. Through dashboards, custom reports, and AI-assisted report creation, sales teams gain real-time visibility into pipeline health, revenue forecasts, and individual performance. More importantly, that visibility drives better coaching, more accurate forecasting, and faster identification of bottlenecks before they cost revenue.
Ultimately, the strength of Pipedrive Insights lies in how tightly it integrates with the rest of Pipedrive CRM. Because reports pull directly from live deal and activity data, sales teams never work from outdated numbers. For organizations ready to get the most from that reporting power, working with an experienced partner such as Solution For Guru ensures Pipedrive is configured correctly from the start, so every report reflects an accurate, well-organized sales process rather than messy data.
Frequently Asked Questions
Core reporting features are available across Pipedrive’s plans, though the more advanced dashboard customization and AI-powered report creation may be limited to higher-tier subscriptions. Consequently, it’s worth checking current plan details directly on Pipedrive’s pricing page before assuming full access.
Pipedrive Insights primarily reports on data already stored within Pipedrive, such as deals, activities, and contacts. However, businesses using integrations or add-on tools can often bring external data into Pipedrive first, after which Insights can include it in reports and dashboards.
No advanced technical skills are required. The report builder uses a simple filter-and-group interface, and the AI-powered option allows users to generate reports through plain-language prompts instead of manual configuration. That said, working with a Pipedrive specialist, such as Solution For Guru, still helps ensure reports are structured around the metrics that matter most for a specific business.
A basic dashboard covering deal counts, revenue, and activity totals can be built within an hour once the pipeline and custom fields are set up correctly. However, a dashboard genuinely tailored to a specific sales process, complete with the right filters, goal tracking, and forecasting logic, typically takes longer and benefits from guided setup, which is one reason many businesses choose to work with an implementation partner rather than building everything from scratch.
Why Should You Partner With Solution For Guru for Your Pipedrive Setup?
Even though Pipedrive Insights is designed to be user-friendly, many organizations still benefit from expert guidance when configuring pipelines, custom fields, and reports correctly from the start. This is where Solution For Guru adds real value.
What Does Solution For Guru Bring to a Pipedrive Implementation?
Solution For Guru specializes in CRM consulting and implementation, helping businesses configure Pipedrive around their actual sales process rather than a generic template. Because reporting accuracy depends entirely on how the CRM is set up, getting pipelines, stages, and custom fields right from day one directly improves the quality of every Insight report built afterward.
How Does Working With Solution For Guru Save Time and Reduce Risk?
Instead of learning Pipedrive through trial and error, teams working with Solution For Guru skip months of guesswork. The team handles data migration, integration with other business tools, and staff training, so sales reps start using the system productively from week one rather than fighting with settings.
What Ongoing Support Does Solution For Guru Provide?
Beyond initial setup, Solution For Guru offers ongoing support as sales processes evolve. Whether a business adds new products, restructures territories, or scales its sales team, Solution For Guru helps adjust the Pipedrive configuration and reporting dashboards accordingly, keeping Insights data relevant over the long term.
In short, partnering with a specialist like Solution For Guru turns Pipedrive Insights from a promising feature into a dependable, business-critical reporting system.
Recommended:
- Pipedrive Automation Examples for Sales Teams
- Pipedrive Sales KPIs: 15 Metrics Every Team Should Track
- How Pipedrive AI Helps Sales Teams Save Time
- CRM Roles 101: From CRM Administrator to CRM Developer
- Pipedrive MCP Explained: How AI Assistants Connect to Your CRM
- Sales Forecasting and Pipeline Management in Creatio CRM
- Pipedrive Sales Dashboard: How to Track Performance
- Pipedrive Automation Triggers and Actions Explained
- Pipedrive AI vs Traditional CRM Automation: What’s the Difference?
- ERP and ITSM Integration: Improving Operational Visibility Across Departments
- Integrating Endpoint Management Tools with Freshservice
- ManageEngine Asset Management (ITAM): Why Businesses Trust It to Control Their IT Assets
- Why Mid-Sized Companies Choose Freshservice Over Enterprise ITSM Platforms
- Best Reporting and Analytics Dashboards for IT Operations Teams in Freshservice
- How ITSM Platforms Support IT Compliance and Audit Readiness
- How ITSM Tools Support Internal IT Risk Management
- How AI Is Changing ITSM Workflows in Freshservice?
- How ITSM Platforms Like Freshservice Support Digital Transformation
- Freshservice CMDB Explained: Structure, Relationships, and Best Practices
- Freshservice for Remote and Hybrid Work Environments