How to Track Sales KPIs in monday CRM: What Should You Measure and How Do You Set It Up?
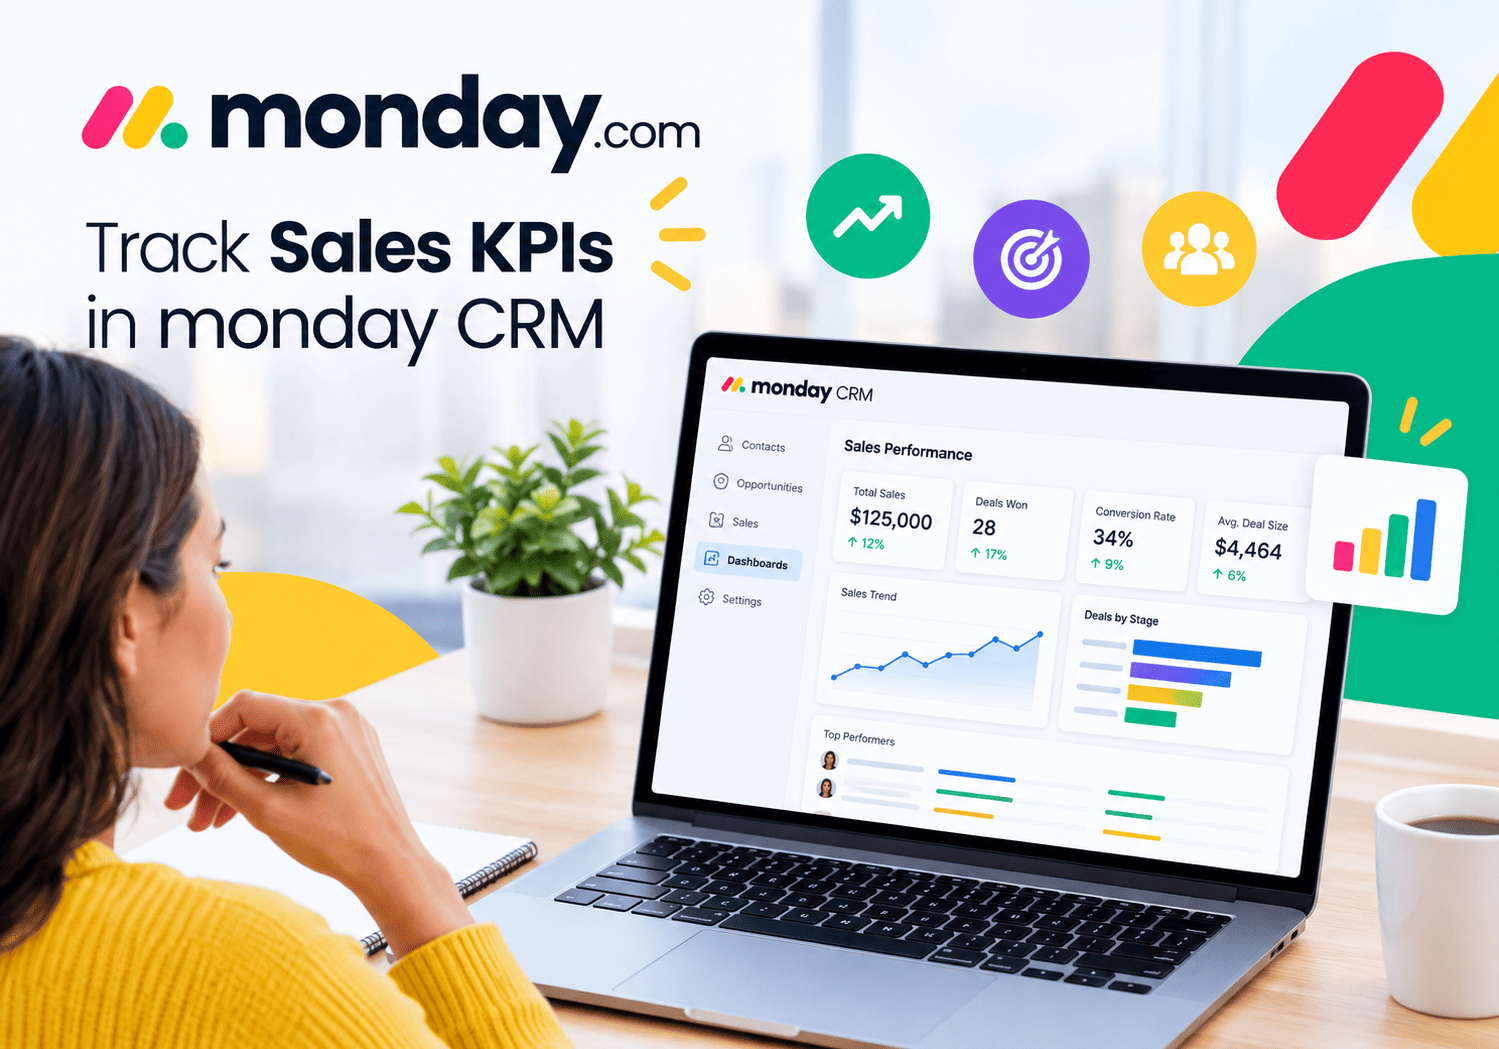
Sales teams generate huge amounts of data, yet many managers still guess which deals will close and which reps need help. Key performance indicators (KPIs) replace that guesswork with clear numbers. This guide shows how to track sales KPIs in monday CRM, from choosing the right metrics to building dashboards, automating updates, and running weekly reviews. It also explains how a digital partner such as Solution for Guru can help you publish and promote this kind of expertise online.
Table of contents
Quick Summary: What Should You Know Before You Start?
- Start with a short list. Track pipeline conversion, win rate, activity volume, and revenue forecasts first.
- Keep data clean. Dashboards only work when reps update deals consistently.
- Use dashboards and automations together. Dashboards show the numbers, and automations keep the data fresh.
- Match views to roles. Reps, managers, and executives need different metrics.
- Review on a schedule. Weekly pipeline checks and monthly KPI reviews build habits.
| Step | Action | Result |
|---|---|---|
| 1 | Choose five to eight KPIs | Focus |
| 2 | Structure boards and columns | Reliable data |
| 3 | Build a dashboard | Real-time visibility |
| 4 | Add automations | Less manual entry |
| 5 | Review weekly and monthly | Action and improvement |
How Does monday.com CRM Relate to Tracking Sales KPIs?

monday.com CRM stores leads, contacts, deals, and activities in customizable boards. It then turns that information into dashboards and reports. This combination makes it a natural fit for KPI tracking because the data lives in the same place where reps do their daily work.
monday describes real-time dashboards and reports that let sales managers monitor team progress, KPIs, and sales activities in one place. Because the dashboards pull from live boards, you avoid the old routine of exporting spreadsheets and rebuilding charts every week.
Moreover, the platform lets you shape the process around your sales cycle. You can customize sales pipelines with drag-and-drop boards and adaptable templates, so the process matches how your team actually works. That flexibility matters for KPIs. When your stages mirror reality, conversion rates and cycle times reflect reality too.
In the sections below, you will see how monday.com CRM supports each step of KPI tracking. You will learn what to measure, how to structure the data, and how to keep the numbers trustworthy.
Why Does Tracking Sales KPIs Matter?
KPIs turn effort into evidence. Without them, managers rely on gut feeling and anecdotes, which rarely scale.
What problems do KPIs solve?
- Hidden bottlenecks: You see which stage loses the most deals.
- Unclear performance: You compare reps fairly using the same metrics.
- Weak forecasts: You predict revenue from real pipeline data.
- Wasted effort: You spot activities that do not lead to wins.
How do dashboards change behavior?
Visibility drives action. monday’s own CRM guide explains that dashboards work like visual command centers that turn raw sales data into charts and metrics you can act on. When reps see their numbers daily, they adjust faster. Managers, in turn, coach earlier instead of waiting for quarter-end surprises.
Why choose a limited set of metrics?
Too many KPIs create noise. Different roles need different views, because reps, managers, and executives make different decisions. Therefore, give each role a small, relevant set. Five to eight KPIs per dashboard usually works well.
Which Sales KPIs Should You Track in monday CRM?

Not every metric deserves a place on your dashboard. Focus on indicators that drive decisions.
What are the core KPIs?
The core KPIs are sales pipeline conversion, win rate by rep, activity volume, and revenue forecasting. Treat these four as your starting point, then add more as your process matures.
Which KPIs fit each category?
monday groups metrics into three areas. Pipeline health, revenue performance, and sales activities are the three categories that actually drive results.
| Category | KPI examples | What it tells you |
|---|---|---|
| Pipeline health | Pipeline value, stage conversion, deal aging | Whether you have enough quality deals |
| Revenue performance | Closed revenue, average deal size, quota attainment | Whether you hit financial targets |
| Sales activity | Calls, emails, meetings, new leads | Whether reps do the work that leads to wins |
How do you define each KPI?
Write a clear definition for every metric. Otherwise, teams argue about numbers instead of acting on them.
| KPI | Common formula |
|---|---|
| Win rate | Deals won ÷ total closed deals |
| Stage conversion | Deals moving to next stage ÷ deals entering stage |
| Average deal size | Total won revenue ÷ number of won deals |
| Sales cycle length | Average days from creation to close |
| Quota attainment | Closed revenue ÷ quota |
Adapt formulas to your business, and document them in a shared note.
How Do You Structure monday CRM Boards for Reliable KPI Data?
Accurate KPIs start with a clean data model. Poor structure leads to poor dashboards, no matter how polished they look.
What columns do you need?
Create columns that support your chosen KPIs. A typical deals board includes:
- Deal name and owner: Shows who is responsible.
- Stage: Tracks pipeline position.
- Deal value: Feeds revenue and forecast metrics.
- Expected close date: Supports forecasting.
- Source: Reveals which channels convert best.
- Created date and closed date: Let you calculate cycle length.
- Lost reason: Explains why deals fail.
How should you define stages?
Use clear, mutually exclusive stages with entry criteria. For example:
- New lead
- Qualified
- Discovery completed
- Proposal sent
- Negotiation
- Closed won
- Closed lost
Define what must happen before a deal moves forward. Consequently, stage conversion rates reflect real progress instead of optimism.
Why does data hygiene matter?
Required fields prevent gaps. Set simple rules, such as “no deal moves to Proposal without a value and a close date.” Also, assign one owner to each deal. These habits keep your dashboards honest.
How do web forms help?
monday CRM lets you set up web forms that feed leads straight into the CRM, so nothing falls through the cracks. Forms capture the source automatically, which improves lead-source reporting.
How Do You Build a Sales KPI Dashboard in monday CRM?
Once your boards are ready, you can build the dashboard. Follow a simple process.
What steps should you follow?

Start by identifying your stakeholders, mapping your process, and collating your metrics; then populate the dashboard with dynamic widgets that show the data your team needs. Here is a practical version:
- List the decisions the dashboard should support.
- Choose KPIs that inform those decisions.
- Connect boards that hold the data.
- Add widgets, such as charts, numbers, and tables.
- Place the most important metrics at the top.
- Share the dashboard with the right people.
- Test with a small group and refine.
Can you start from a template?
Yes. monday CRM includes ready-made templates to get you up and running quickly. Templates save time, though you should still adjust them to match your stages and metrics.
What should a first dashboard contain?
| Widget | Purpose |
|---|---|
| Pipeline value by stage | Shows funnel shape |
| Win rate by rep | Compares performance |
| Revenue vs target | Tracks progress to goal |
| Activities this week | Monitors effort |
| Deals closing this month | Supports forecasting |
Can AI help?
monday has built AI into its CRM. Users can ask monday sidekick or monday agents to build or adjust dashboards for them. AI features and availability vary by plan, so check your account before you plan around them.
How Do You Track Pipeline Health With monday CRM?
Pipeline KPIs tell you whether future revenue looks healthy. They deserve the top spot on most dashboards.
Which pipeline metrics matter most?
- Total pipeline value: The sum of all open deals.
- Pipeline coverage: Pipeline value divided by quota. Many teams target a multiple of quota, though the right ratio depends on your win rate.
- Stage conversion: The share of deals that advance.
- Deal aging: How long deals sit in each stage.
- Stalled deals: Deals with no activity for a set period.
How do stage conversion rates help?
Stage conversion rates identify the best-performing stages of the sales funnel. If many deals die between Proposal and Negotiation, you know where to focus coaching, pricing, or content.
How can you flag problem deals?
Customizable pipeline widgets and conditional labels flag deals that need immediate attention. For example, color deals red when they sit in one stage for more than 14 days. As a result, managers spot risk without reading every row.
What example shows the value?
Imagine a team with 60 open deals worth $900,000 and a quarterly quota of $400,000. The pipeline seems large. However, 25 deals have had no activity for three weeks. After the team removes or revives them, the real pipeline shrinks to $520,000. The example uses made-up numbers, but it shows why aging metrics prevent false confidence.
How Do You Track Revenue and Forecast Accuracy in monday CRM?

Revenue KPIs connect sales work to business results. They also support planning for hiring, inventory, and cash flow.
Which revenue KPIs should you include?
| KPI | Why it matters |
|---|---|
| Closed-won revenue | Shows actual results |
| Quota attainment | Measures goal progress |
| Average deal size | Helps forecast and pricing |
| Weighted pipeline | Estimates likely revenue |
| Forecast vs actual | Tests forecast accuracy |
How do you build a basic forecast?
Assign a probability to each stage, for example, 10% for Qualified and 60% for Proposal. Multiply each deal’s value by its stage probability, then add the results. This gives a weighted pipeline. Compare it with actual closed revenue every month, and adjust probabilities using your real conversion rates.
Why track forecast accuracy?
Forecasts only help when leaders trust them. Therefore, record your forecast at the start of each month and compare it with the result. If you miss by a wide margin repeatedly, review stage definitions and close-date discipline.
How can you share results with leadership?
monday says you can quickly build and export reports on sales metrics and forecasts to keep senior management informed. Use a monthly executive dashboard with only a few headline metrics, such as closed revenue, forecast, and win rate.
How Do You Track Sales Activity and Rep Performance?
Revenue comes from activity. Activity KPIs show whether your team does the work that creates future wins.
Which activity metrics should you track?
- Calls made
- Emails sent
- Meetings booked and held
- New leads created
- Follow-ups completed on time
How do you avoid vanity metrics?
Count activities that link to outcomes. Ten calls that never reach a decision-maker may matter less than three strong discovery meetings. Compare activity volume with conversion rates to find the right balance.
How can you compare reps fairly?
Use ratios, not only totals. For example, compare meetings per 100 leads or win rate per 20 qualified opportunities. Territory, deal size, and tenure also affect results, so avoid public rankings that discourage new reps.
How can you coach with the data?
Managers can track KPIs, monitor sales activities, and use real-time dashboards to identify challenges and opportunities within the team. A weekly one-on-one can follow this pattern:
- Review the rep’s pipeline and aging deals.
- Compare activity with team averages.
- Choose one behavior to improve.
- Agree on a target for next week.
This approach turns numbers into support rather than pressure.
How Can Automations Keep monday CRM KPIs Accurate?

Dashboards fail when data goes stale. Automation reduces that risk.
What can automations handle?
With no-code automations, monday CRM can handle repetitive tasks such as reminders, follow-ups, and data entry, so reps spend more time selling. Several automations directly improve KPI quality:
- Set the closed date when a deal moves to Closed won.
- Notify the owner when a deal sits in a stage too long.
- Create a follow-up task after a meeting.
- Require a lost reason when a deal moves to Closed lost.
- Alert the manager when a high-value deal stalls.
How do you introduce automations safely?
Start with two or three simple rules. Test them on a small board, then expand. Too many automations at once can confuse reps and create noise.
Why does mobile access matter?
monday CRM is cloud-based with a mobile app, so reps can log calls and update records wherever they are. Faster updates mean fresher KPIs, especially for field teams.
What common mistakes should you avoid?
| Mistake | Better approach |
|---|---|
| Automating a messy process | Fix the process first |
| Ignoring exceptions | Allow manual overrides with notes |
| Skipping testing | Pilot with one team |
| Never reviewing rules | Audit automations quarterly |
How Often Should You Review Sales KPIs?
A dashboard does nothing unless people look at it. Build a review rhythm that fits your team.
What cadence works well?
| Frequency | Focus | Participants |
|---|---|---|
| Daily | Personal tasks, activities, hot deals | Reps |
| Weekly | Pipeline health, stalled deals, next steps | Reps and manager |
| Monthly | Revenue vs target, forecast accuracy, win rate | Sales leadership |
| Quarterly | KPI definitions, targets, process changes | Sales and operations |
Why refine the dashboard over time?
A CRM dashboard is never finished. Business goals shift, and so should your metrics. After each quarter, ask which widgets people use and which they ignore. Remove unused items and add metrics that support new goals.
How do you build adoption?
- Explain why each KPI matters.
- Show reps how their data feeds the dashboard.
- Celebrate improvement, not only top performance.
- Ask for feedback on the layout.
- Keep the dashboard simple.
What if data looks wrong?
Investigate before you react. Check for missing fields, duplicate deals, or inconsistent stage use. Fix the cause, then communicate the change to the team so trust stays intact.
Can You Combine monday CRM KPIs With Other Data Sources?
Many teams want to see sales numbers next to marketing, support, or finance data. Integrations make that possible.
Why integrate?
Sales KPIs gain context when you combine them with other signals. For example, linking lead source data with marketing spend reveals cost per acquired customer. Likewise, linking pipeline data with support tickets may show why some accounts churn.
What options exist?
Third-party business intelligence tools offer connectors. One vendor, for instance, describes a connector that pulls sales KPIs from monday Sales CRM and a VoIP system into interactive dashboards. Check each tool’s documentation, pricing, and security terms before you connect it.
What should you consider?
- Data ownership: Know where your data goes.
- Refresh frequency: Confirm how often it updates.
- Cost: Compare add-on fees with the value.
- Complexity: Start with native dashboards, then add tools only when needed.
Most small and mid-sized teams get plenty of value from native dashboards alone.
What Are the Key Conclusions About Tracking Sales KPIs in monday CRM?
Tracking sales KPIs works best when you combine clear definitions, clean data, and regular reviews. monday.com CRM supports each step with customizable boards, real-time dashboards, templates, automations, and a mobile app that keeps records current.
Remember these takeaways:
- Start small. Track pipeline conversion, win rate, activity volume, and forecast first.
- Structure data carefully. Clear stages and required fields protect accuracy.
- Build role-based dashboards. Reps, managers, and executives need different views.
- Automate routine updates. Fresh data builds trust in the numbers.
- Review on a schedule. Weekly and monthly routines turn metrics into action.
Finally, if you want to share your CRM and sales knowledge with a wider audience, consider working with Solution for Guru for SEO, content, and website support.
Frequently Asked Questions
Start with four core metrics: pipeline conversion, win rate by rep, activity volume, and revenue forecasting. These indicators cover pipeline health, results, and effort. After a few weeks, add metrics such as average deal size and sales cycle length.
monday CRM includes ready-made dashboard templates and dynamic widgets, and it offers AI assistants that can help build or change dashboards. Features vary by plan, so check your account and monday’s documentation. Even with automation, review the result and adjust it to your own stages and KPIs.
Reps should check their own numbers daily. Managers should review pipeline health weekly, and leadership should review revenue and forecast accuracy monthly. A quarterly review of KPI definitions and targets keeps the system aligned with your goals.
What Are the Benefits of Cooperating With Solution for Guru?
Good KPI tracking improves your sales results. Good content improves your visibility. Solution for Guru supports companies with the second goal.
What services does the company provide?
Its HubSpot partner listing shows services such as search engine optimization, content creation, website design and development, inbound marketing, custom API integration, and social media. The listing also shows remote delivery, English-language support, and service to EMEA and the Americas.
How can this help CRM and sales content publishers?
- SEO-focused content: Guides like this one target the questions buyers search for.
- Conversion-focused websites: The company describes its sites as tools that turn visitors into clients.
- Technical integration: Custom API work can connect forms, CRM tools, and analytics.
- Flexible budgets: The listing states that the team works with any budget.
- Ongoing monitoring: Regular metric reviews help you refine campaigns.
Why does this matter for software content?
CRM and sales topics attract heavy competition and rapid product changes. A partner that combines SEO, content, and web development helps you publish accurate pages, update them quickly, and capture leads. As a result, you build authority without juggling several separate vendors.
Recommended:
- How can monday.com CRM Improve Sales Team Productivity?
- Email Integration in Bigin: Gmail and Outlook for Small Business Sales
- How Does monday CRM Work?
- How Do Bigin’s Automation Features Save Time for Growing Teams?
- What Is monday CRM? A Complete Guide to monday.com CRM
- Bigin Mobile App Review: Managing Sales on the Go
- CRM Proficiency Is the New Digital Literacy: Do You Agree?
- Bigin by Zoho CRM Pricing Explained: Is It Worth It?
- Using Creatio to Standardize Business Processes Across Departments
- Best Pipedrive Reports for Sales Managers
- Pipedrive Insights Explained: How Sales Reporting Works
- Pipedrive Automation Examples for Sales Teams
- Pipedrive Sales KPIs: 15 Metrics Every Team Should Track
- How Pipedrive AI Helps Sales Teams Save Time
- CRM Roles 101: From CRM Administrator to CRM Developer
- Pipedrive MCP Explained: How AI Assistants Connect to Your CRM
- Sales Forecasting and Pipeline Management in Creatio CRM
- Pipedrive Sales Dashboard: How to Track Performance
- Pipedrive Automation Triggers and Actions Explained
- Pipedrive AI vs Traditional CRM Automation: What’s the Difference?
- ERP and ITSM Integration: Improving Operational Visibility Across Departments
- Integrating Endpoint Management Tools with Freshservice