What Are ITSM KPIs and Why Do They Matter for Your IT Organization?

IT departments today face mounting pressure to deliver reliable, fast, and cost-effective services. Yet without the right metrics, IT teams often operate blindly — fixing problems reactively, missing trends, and failing to demonstrate business value. That is exactly where ITSM KPIs come in.
IT Service Management (ITSM) Key Performance Indicators give organizations a structured, data-driven way to evaluate how well IT services align with business goals. Whether you manage a small helpdesk or a global IT operation, tracking the right KPIs transforms guesswork into strategy.
Table of contents
Quick Summary
| What You Will Learn | Details |
|---|---|
| What ITSM KPIs are | Definition, purpose, and importance |
| Core KPI categories | Incident, change, SLA, problem, and more |
| Top ITSM platforms | ManageEngine ServiceDesk Plus and Freshservice |
| Platform comparison | Feature-by-feature table |
| Best practices | How to set, monitor, and improve KPIs |
| Expert partner | Benefits of working with Solution for Guru |
How Do ManageEngine and Freshservice Connect to ITSM KPIs?
Before diving into individual metrics, it is worth understanding which tools actually power ITSM KPI tracking at scale.
ManageEngine ServiceDesk Plus is a comprehensive ITSM platform that gives IT teams deep reporting and analytics capabilities. It tracks incidents, service requests, changes, assets, and problems through a unified dashboard. ManageEngine enables organizations to define custom KPIs, build real-time dashboards, and export reports aligned with ITIL best practices. Consequently, teams using ManageEngine can instantly see metrics like Mean Time to Resolve, SLA compliance, and first-call resolution rates.
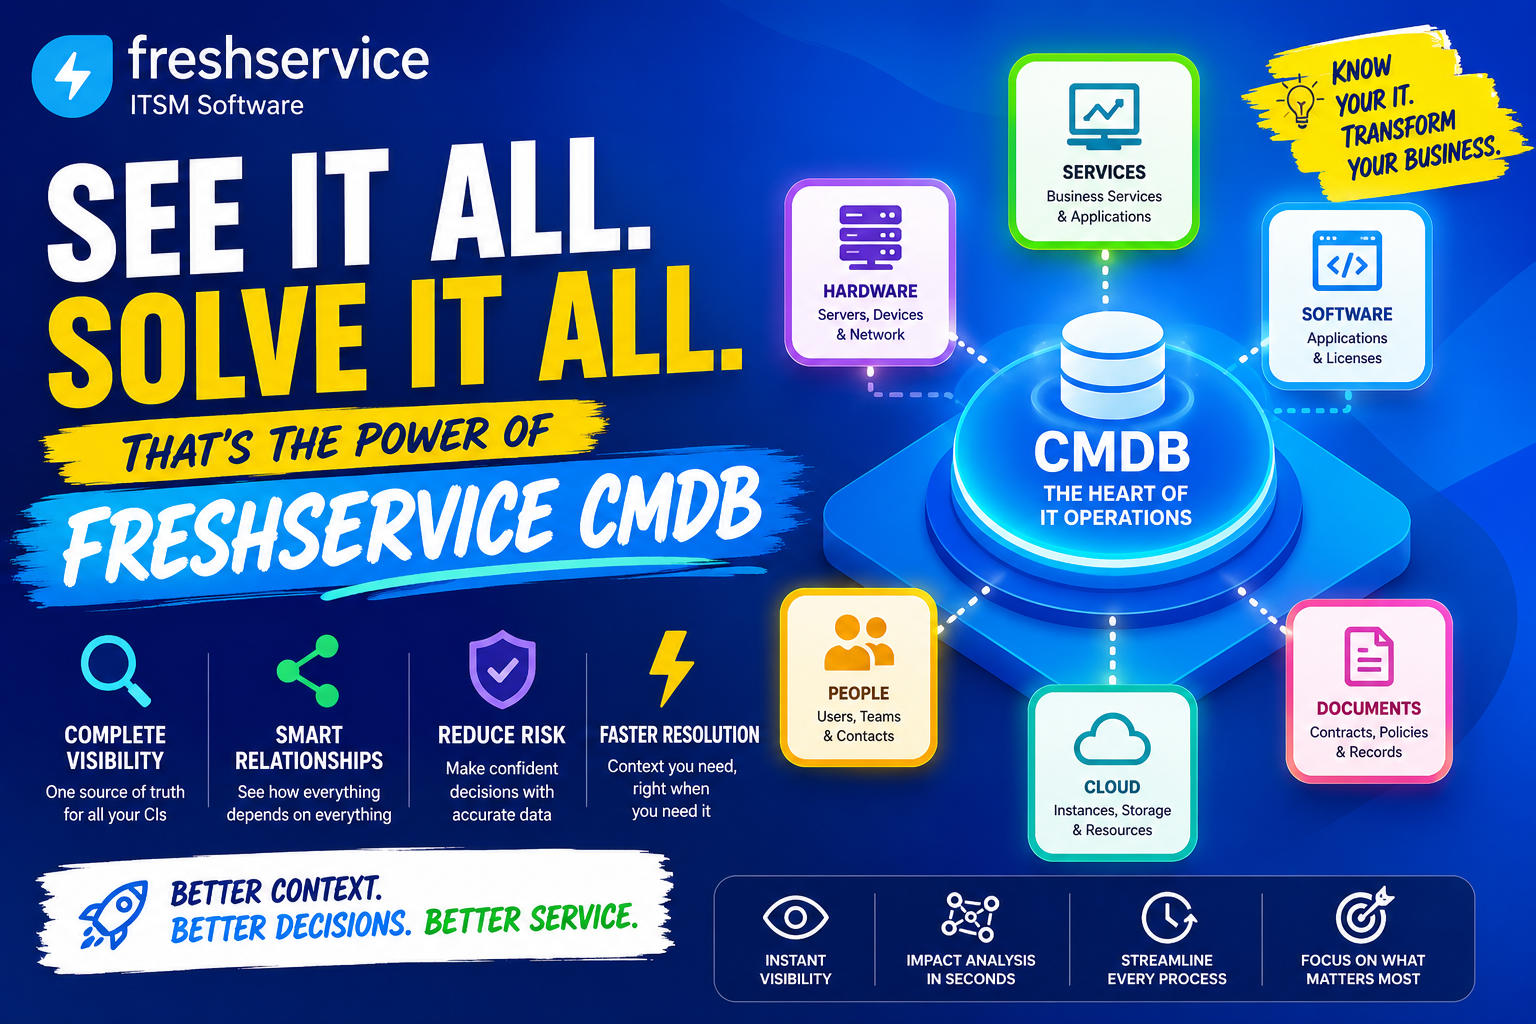
Freshservice by Freshworks brings a modern, AI-powered approach to ITSM. Its intuitive interface makes KPI visibility accessible even for non-technical stakeholders. Freshservice delivers built-in analytics modules that track ticket volume trends, agent productivity, change success rates, and customer satisfaction scores. Moreover, its smart suggestions and automation features actively help teams improve the KPIs they are tracking — not just report on them.
Both platforms serve as the operational backbone for ITSM KPI programs, and both integrate seamlessly with third-party monitoring, HR, and business tools.
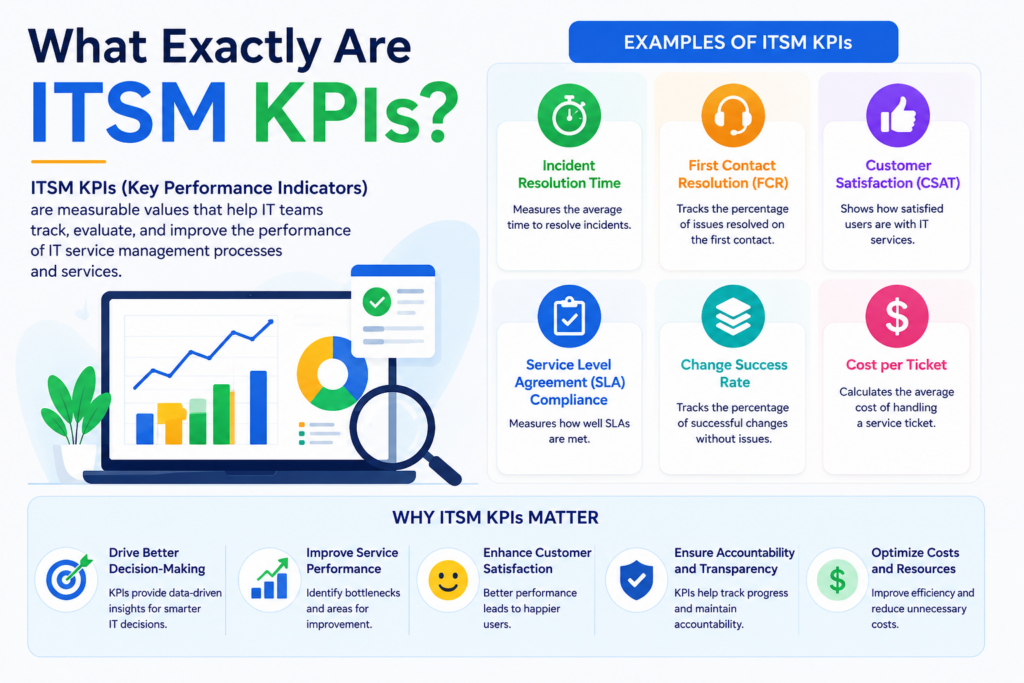
What Exactly Are ITSM KPIs?
How Do KPIs Differ from General IT Metrics?
Metrics are raw data points — the number of tickets opened today, server uptime this week. KPIs, however, are strategic measurements tied to specific organizational goals. An ITSM KPI answers the question: “Are we meeting the performance standard that matters to the business?”
For example:
- Metric: 200 tickets closed this week
- KPI: 94% of Priority 1 incidents resolved within the agreed 4-hour SLA window
The KPI adds context, targets, and accountability that raw metrics alone cannot provide. Furthermore, ITSM KPIs connect IT performance to executive-level conversations about risk, efficiency, and investment.
Why Do Organizations Track ITSM KPIs?
Organizations that actively track ITSM KPIs gain four core advantages:
- Visibility — Real-time insight into service health and team performance
- Accountability — Clear ownership of targets and outcomes
- Continuous improvement — Data to identify bottlenecks and fix root causes
- Business alignment — Proof that IT investments deliver measurable value
According to the IT Infrastructure Library (ITIL) framework — the globally adopted standard for ITSM — KPIs are essential components of every service lifecycle stage, from strategy through continual service improvement.
What Are the Most Important ITSM KPI Categories?
Which KPIs Should Incident Management Teams Track?
Incident management focuses on restoring normal service operations as quickly as possible. Therefore, the KPIs in this category emphasize speed, accuracy, and user satisfaction.
Key Incident Management KPIs:
| KPI | Definition | Target (Best Practice) |
|---|---|---|
| Mean Time to Resolve (MTTR) | Average time from incident open to close | < 4 hours (P1) |
| Mean Time to Acknowledge (MTTA) | Time from ticket creation to first agent response | < 15 minutes (P1) |
| First Call Resolution Rate (FCR) | % of incidents resolved on first contact | > 70% |
| Incident Reopen Rate | % of incidents reopened after closure | < 5% |
| SLA Compliance Rate | % of incidents resolved within agreed timeframes | > 95% |
| Incident Volume by Category | Count of incidents grouped by type/team | Trending down |
Both ManageEngine and Freshservice make these KPIs visible through real-time dashboards. ManageEngine allows teams to build custom SLA policies per priority level, while Freshservice uses AI to auto-categorize and prioritize tickets — directly improving MTTA and FCR scores.
How Do You Measure Service Request Performance?
Service requests — password resets, software installs, access grants — make up a significant share of IT workload. Tracking them separately from incidents helps organizations distinguish reactive firefighting from planned service delivery.
Core Service Request KPIs:
- Service Request Fulfillment Time: Average time to complete a request from submission to delivery
- Pending Request Rate: Percentage of requests waiting for approval or action beyond the target window
- Self-Service Adoption Rate: Percentage of requests submitted via the self-service portal vs. email or phone
- Request Abandon Rate: Percentage of self-service sessions where users left without submitting
Freshservice excels in this area with its no-code service catalog builder and AI-powered chatbot, which dramatically increases self-service adoption. ManageEngine equally offers a fully customizable service catalog with approval workflows, escalation rules, and multi-tier approvals, all of which directly influence fulfillment time KPIs.
What KPIs Matter Most for Change Management?
Change management aims to minimize the risk of IT disruptions caused by changes to infrastructure, applications, or configurations. Accordingly, KPIs here focus on success, speed, and risk.
Change Management KPIs:
| KPI | Definition | Why It Matters |
|---|---|---|
| Change Success Rate | % of changes implemented without incident | Measures planning quality |
| Emergency Change Rate | % of changes classified as emergency | High rate signals poor planning |
| Change Lead Time | Average time from request to implementation | Reflects agility of the change process |
| Failed Change Rate | % of changes that caused unplanned incidents | Tracks risk and impact |
| Unauthorized Changes | Count of changes made without approval | Critical compliance metric |
A high Emergency Change Rate often signals reactive IT culture rather than proactive change planning. ManageEngine‘s change advisory board (CAB) workflows and Freshservice‘s AI-powered change risk assessment both help teams reduce emergency changes over time — turning this KPI from a problem indicator into a continuous improvement driver.
How Do Problem Management KPIs Prevent Recurring Incidents?
Problem management identifies and eliminates the root causes of incidents, preventing their recurrence. This is one of the most strategic areas of ITSM, yet many organizations under-invest here.
Problem Management KPIs:
- Known Error Ratio: Percentage of problems with documented workarounds in the knowledge base
- Problem Resolution Time: Average time from problem identification to root cause fix
- Recurring Incident Rate: Percentage of incidents linked to known, unresolved problems
- Problems Linked to Changes: Percentage of problems traceable to recent changes
Reducing the Recurring Incident Rate is one of the clearest signs that problem management is working. ManageEngine supports root cause analysis workflows and links problems directly to related incidents. Freshservice similarly provides problem-to-incident correlation and uses ML to surface patterns in ticket data — giving teams proactive insight rather than reactive discovery.
Which SLA KPIs Define Service Quality?
Service Level Agreements (SLAs) are the backbone of IT accountability. SLA KPIs demonstrate to business stakeholders whether IT is delivering on its promises.
Essential SLA KPIs:
| KPI | Definition |
|---|---|
| SLA Compliance Rate | % of tickets resolved within agreed SLA window |
| SLA Breach Count | Total number of SLA violations per period |
| Near-Miss Rate | % of tickets that came close to breaching SLA |
| Escalation Rate | % of tickets escalated due to SLA risk |
| OLA Compliance | Operational-level agreement adherence between internal teams |
Both ManageEngine and Freshservice allow multi-tier SLA policies with automatic escalation notifications when tickets approach breach thresholds. This proactive alerting helps teams intervene before SLAs fail — keeping compliance rates high and stakeholder confidence intact.
What Are the Top ITSM KPIs for Asset and Configuration Management?
Managing IT assets and the configuration items (CIs) that underpin your services is critical for both cost control and service continuity.
Asset and CMDB KPIs:
- Asset Utilization Rate: Percentage of hardware and software assets actively in use
- License Compliance Rate: Percentage of software installations covered by valid licenses
- CMDB Accuracy Rate: Percentage of configuration items with correct, up-to-date records
- Asset Lifecycle Stage Distribution: Breakdown of assets by lifecycle stage (active, expiring, retired)
ManageEngine stands out with its built-in IT Asset Management (ITAM) module and CMDB, which automatically discover and update asset records. Freshservice also includes a powerful asset management layer with native discovery tools and integrations with endpoint management platforms.
How Do You Track IT Team Productivity and Workload?
Beyond service quality, ITSM KPIs also help IT managers understand team capacity, agent performance, and staffing needs.
Agent and Team Productivity KPIs:
| KPI | Definition |
|---|---|
| Tickets Per Agent | Average number of tickets handled per agent per day |
| Average Handle Time | Mean time an agent spends actively working on a ticket |
| Backlog Size | Total number of open tickets at any point in time |
| Agent Utilization Rate | % of available agent time spent on active tickets |
| Knowledge Base Deflection Rate | % of issues resolved via self-service before ticket creation |
A growing backlog combined with declining FCR often signals understaffing or inadequate training. Both platforms generate agent productivity reports that managers can use to make data-driven staffing and coaching decisions.
How Does Customer Satisfaction Fit Into ITSM KPIs?
Ultimately, IT service management exists to serve people. Therefore, end-user satisfaction is one of the most important KPIs of all.
Customer Experience KPIs:
- Customer Satisfaction Score (CSAT): Post-resolution survey score from users (typically 1–5 scale)
- Net Promoter Score (NPS): Likelihood of users recommending the IT service to colleagues
- Survey Response Rate: Percentage of closed tickets that receive user feedback
Freshservice sends automated CSAT surveys after ticket closure and surfaces satisfaction trends in its analytics dashboard. ManageEngine equally supports configurable satisfaction surveys, and both platforms allow segmenting CSAT data by team, category, or time period — making it easy to spot which service areas need improvement.
How Do ManageEngine and Freshservice Compare for ITSM KPI Tracking?

The table below provides a direct feature comparison of both platforms across the most critical ITSM KPI areas.
| Feature / Capability | ||
|---|---|---|
| Incident KPI Dashboards | ✔ Custom dashboards with real-time data | ✔ Pre-built and customizable dashboards |
| SLA Management | ✔ Multi-tier, per-priority SLA policies | ✔ Smart SLA with AI risk detection |
| Change Risk Analytics | ✔ CAB workflows and change calendar | ✔ AI-powered change risk assessment |
| Problem Management | ✔ Root cause analysis with incident linking | ✔ ML-based incident pattern detection |
| Asset & CMDB | ✔ Built-in ITAM + auto-discovery CMDB | ✔ Agent-based discovery + integrations |
| Self-Service Portal | ✔ Customizable portal with knowledge base | ✔ AI chatbot + no-code service catalog |
| CSAT / User Surveys | ✔ Configurable post-resolution surveys | ✔ Automated CSAT with trend analytics |
| Reporting & Export | ✔ Scheduled reports, PDF/CSV/XLS export | ✔ Analytics module with custom reports |
| ITIL Alignment | ✔ Full ITIL v3/v4 process coverage | ✔ ITIL-aligned with modern UX focus |
| AI / Automation | ✔ Workflow automations + AI assist | ✔ Freddy AI for classification, routing |
| Deployment Options | Cloud, On-Premise, Hybrid | Cloud-only (SaaS) |
| Best Suited For | Mid-to-large enterprises, regulated industries | Fast-growing companies, modern IT teams |
| Starting Price | From ~$10/technician/month | From ~$19/agent/month |
Both platforms serve the ITSM KPI tracking mission well. The right choice depends on your deployment preference, team size, existing tech stack, and how deeply you need to customize workflows and reports.
How Do You Build a Successful ITSM KPI Program?
What Steps Should You Follow When Setting Up ITSM KPIs?

Establishing a KPI program is not simply a matter of enabling dashboards and picking metrics. Instead, it requires a deliberate, structured approach tied to business outcomes.
Step-by-step process:
- Define business objectives first — Understand what the business needs IT to deliver (uptime, speed, cost, satisfaction)
- Select relevant KPIs — Choose metrics that directly reflect those objectives; avoid vanity metrics
- Set realistic baselines — Measure current performance before setting targets
- Define targets and owners — Every KPI needs a clear owner and a specific, time-bound target
- Configure your ITSM platform — Set up dashboards, SLA policies, and automated alerts in ManageEngine or Freshservice
- Review regularly — Conduct monthly or quarterly KPI reviews with IT leadership and stakeholders
- Iterate — Use KPI data to identify bottlenecks, adjust processes, and retarget
What Common Mistakes Should You Avoid with ITSM KPIs?
Even well-intentioned ITSM programs fall into traps that undermine their value. Here are the most common mistakes — and how to avoid them:
- Tracking too many KPIs: More metrics do not equal more insight. Focus on 8–12 core KPIs to start, then expand as your program matures.
- Ignoring qualitative data: CSAT scores and user feedback complement quantitative KPIs. Both together paint a complete picture.
- Setting targets without baselines: Targets pulled from benchmarks may not reflect your environment. Always establish your own baseline first.
- Not acting on data: KPI dashboards are useless without a culture of response. Every KPI breach should trigger a structured review.
- Siloing KPI ownership: ITSM KPIs work best when shared across IT leadership, not locked inside one team or manager.
Conclusions: What Should You Take Away About ITSM KPIs?
ITSM KPIs are not optional extras for mature IT teams — they are foundational tools for any organization that takes service quality seriously. Without them, IT departments struggle to identify inefficiencies, justify investments, or demonstrate value to the business.
The most successful ITSM programs combine three essential elements: the right platform, the right metrics, and the right partner.
ManageEngine ServiceDesk Plus delivers the depth, flexibility, and on-premise deployment options that mid-to-large enterprises and regulated industries demand. Its comprehensive ITAM, CMDB, and custom reporting make it an excellent choice for organizations with complex environments and high customization needs.
Freshservice brings modern UX, AI-driven automation, and cloud-native agility to ITSM. It is the ideal platform for growing companies that want powerful KPI visibility without the operational overhead of on-premise infrastructure.
Together, these platforms cover the full spectrum of ITSM KPI needs — from incident response times and SLA compliance to asset utilization and customer satisfaction. The key, however, is implementation quality. A poorly configured platform produces misleading metrics; a well-configured one becomes the engine of continuous improvement.
That is precisely why partnering with an experienced provider like Solution for Guru makes the difference between a KPI program that looks good on paper and one that genuinely drives IT excellence.
Start with clarity on your business objectives, choose a platform that fits your environment, track the KPIs that matter most, and work with experts who understand the full picture. The result will be an IT function that does not just respond to problems — but actively prevents them.
Frequently Asked Questions About ITSM KPIs
A metric is any measurable data point — ticket volume, server uptime, number of changes deployed. A KPI is a strategic measurement that connects directly to a specific business goal or service level commitment. Every KPI is a metric, but not every metric qualifies as a KPI. For example, total ticket count is a metric; SLA compliance rate is a KPI, because it measures whether IT is meeting its commitments to the business. When building your ITSM program, start with your business objectives and work backward to identify which metrics become KPIs.
Most ITIL practitioners recommend starting with 8–12 core KPIs across the most critical service management processes — typically incident management, change management, SLA compliance, and customer satisfaction. Tracking too many KPIs dilutes focus and leads to “dashboard paralysis,” where teams spend more time reviewing data than acting on it. As your program matures and processes stabilize, you can gradually expand your KPI set to cover additional areas like problem management, asset compliance, and self-service adoption.
ManageEngine and Freshservice improve ITSM KPIs in two distinct ways. First, they make KPIs visible through real-time dashboards, automated alerts, and scheduled reports — ensuring teams always know where performance stands. Second, they directly improve the underlying processes that KPIs measure. For example, Freshservice’s AI-powered ticket categorization reduces MTTA by routing tickets to the right team instantly. ManageEngine’s SLA escalation rules prevent breaches before they happen. Both platforms also enable automation of repetitive tasks, freeing agents to focus on complex issues — directly improving FCR and CSAT scores over time.
How Can Solution for Guru Help You Maximize Your ITSM KPI Program?
Implementing an ITSM platform and tracking KPIs effectively takes more than software — it takes experienced guidance. That is where Solution for Guru delivers real, measurable value.
Solution for Guru is a specialized IT solutions partner that helps organizations implement, configure, and optimize leading ITSM platforms including ManageEngine and Freshservice. Their team combines deep technical expertise with practical ITSM process knowledge, which means they do not just install software — they build programs that actually improve KPIs.
Key benefits of partnering with Solution for Guru:
- Expert platform implementation: Solution for Guru configures ManageEngine and Freshservice to match your specific workflows, SLA structures, and reporting needs — reducing time-to-value from months to weeks.
- KPI framework design: Their consultants help you select the right KPIs for your organization, set realistic targets, and connect metrics to business goals.
- Custom dashboard development: Solution for Guru builds role-specific dashboards so executives, managers, and agents each see the data most relevant to their responsibilities.
- Training and change management: Rolling out a new ITSM platform or KPI program requires user adoption. Solution for Guru provides structured training programs that accelerate adoption and reduce resistance.
- Ongoing optimization: As your organization evolves, so do your KPI needs. Solution for Guru offers ongoing support to adjust configurations, add new metrics, and align with new ITIL practices.
- Vendor-neutral advisory: Their expertise across multiple platforms means they recommend the right solution for your situation — not the one that benefits them most.
Organizations that work with Solution for Guru consistently report faster platform adoption, higher SLA compliance rates, and improved CSAT scores within the first six months of engagement. Furthermore, their structured approach ensures that your ITSM KPI program stays aligned with long-term business strategy — not just short-term fixes.
Recommended:
- What Is a Self-Service Portal in ITSM and Why Does Your Business Need One?
- ESM vs ITSM: What Is the Difference and Which One Does Your Business Need?
- Freshservice for Non-IT Departments: HR, Facilities, Finance, and Operations
- Can Freshservice Reduce IT Operational Costs?
- ITSM Workflow Optimization Strategies for Hybrid Work Environments
- Breaking Down the ITSM Model: What Are the Core Processes, Roles, and Value Streams?
- Common ITSM Deployment Mistakes Businesses Make — and How to Avoid Them
- ITSM for DevOps Teams: Bridging Agile and Service Management
- Event-Driven ITSM: How Do You Connect Monitoring Alerts to Automated Ticketing?
- Integrating Monitoring Tools with ManageEngine or Freshservice for Proactive Support
- Freshservice Asset Management vs ManageEngine Asset Discovery
- On-Premise vs Cloud ITSM: Choosing Between ManageEngine and Freshservice Architectures
- Freshservice for Internal IT Support: What Problems Does It Solve?
- How Does Freshservice Simplify IT Service Management for Modern Organizations?
- How Do Businesses Integrate Slack and Microsoft Teams with ITSM Platforms?
- Automating Software License Tracking with ITSM Solutions: How Can You Take Control?