Integrating Monitoring Tools with ManageEngine or Freshservice for Proactive Support
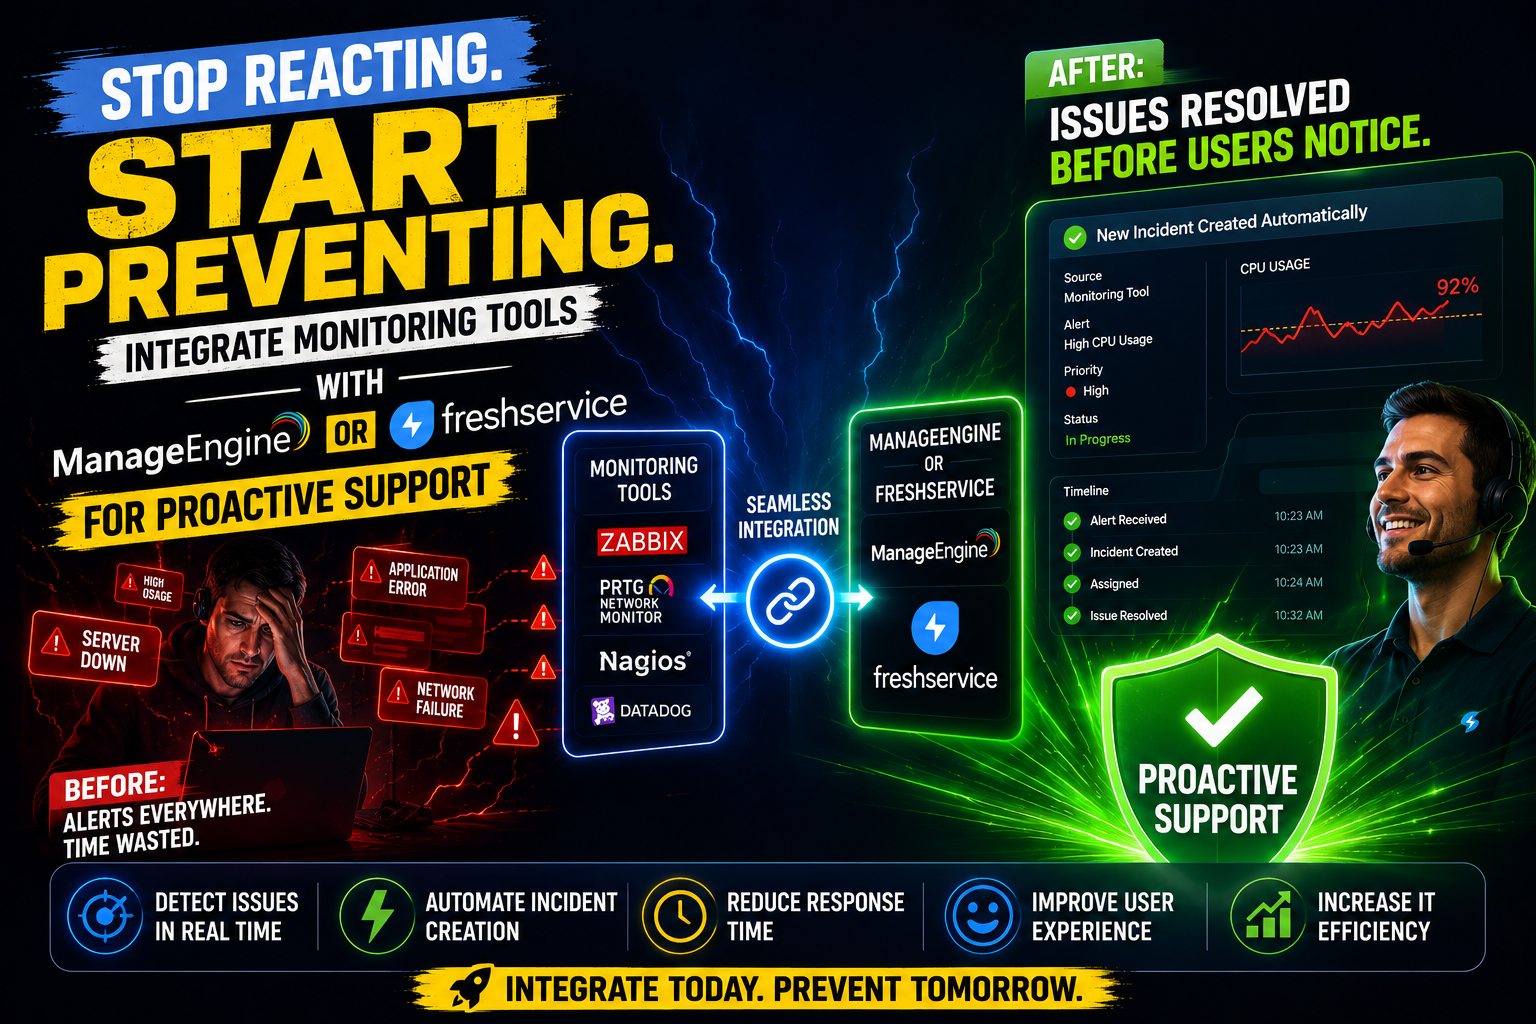
IT teams no longer have the luxury of waiting for users to report problems. Today, every minute of undetected downtime translates into lost productivity, frustrated customers, and measurable revenue impact. The shift from reactive to proactive IT support has therefore become one of the defining priorities of modern IT service management (ITSM). Integrating infrastructure monitoring tools with robust ITSM platforms — specifically ManageEngine ITSM and Freshservice — gives organizations the ability to detect, diagnose, and resolve incidents before they escalate into full-scale outages. This article explores how these integrations work, why they matter, and how to implement them effectively.
Table of contents
Quick Summary
| Topic | Key Point |
| Core concept | Connecting monitoring tools to ITSM platforms enables automated, proactive incident management |
| Platforms covered | ManageEngine ITSM and Freshservice |
| Key integrations | Nagios, Zabbix, Datadog, Prometheus, SolarWinds, and more |
| Primary benefit | Faster detection, automated ticket creation, and reduced MTTR |
| Who benefits | IT operations, DevOps teams, help desks, and service desk managers |
| Comparison | Side-by-side feature analysis of ManageEngine vs. Freshservice |
| Implementation support | Solution for Guru provides expert integration and ITSM configuration services |
How Do ManageEngine ITSM and Freshservice Relate to Proactive IT Support?
Before diving into integrations, it is essential to understand what each platform brings to the table and why both are central to this discussion.
What role does ManageEngine ITSM play in monitoring integration?
ManageEngine ITSM — delivered primarily through ServiceDesk Plus — is a comprehensive IT service management suite developed by Zoho Corporation. It covers the full ITIL framework, including incident, problem, change, release, and asset management. Crucially, ManageEngine belongs to a broader ecosystem that also includes OpManager (network monitoring), Applications Manager (APM), and Log360 (SIEM). This native ecosystem gives IT teams a significant advantage: monitoring data and service desk workflows share a common infrastructure, making integrations tighter and more reliable than third-party patchwork solutions.
Furthermore, ManageEngine ITSM supports API-driven integrations with external monitoring tools, webhooks for real-time event capture, and automation rules that transform incoming alerts into structured ITSM workflows. As a result, organizations using ManageEngine can build a unified operations center where monitoring events and service desk activities converge on a single platform.
How does Freshservice contribute to proactive monitoring workflows?

Freshservice is a cloud-native ITSM platform developed by Freshworks, designed with modern, API-first architecture. It provides ITIL-aligned service management with a strong emphasis on user experience, automation, and extensibility. Freshservice’s Marketplace offers hundreds of pre-built integration connectors for monitoring tools such as Datadog, PagerDuty, Prometheus, Nagios, and New Relic, enabling teams to connect their observability stack in minutes rather than weeks.
Additionally, Freshservice‘s Freddy AI capabilities layer intelligent automation on top of these integrations. When a monitoring alert triggers a ticket, Freddy can automatically classify the incident, suggest relevant knowledge base articles, assign it to the right team, and even predict the urgency based on historical patterns. Consequently, Freshservice transforms raw monitoring data into intelligent, actionable service desk workflows — precisely what proactive IT support demands.
What Is Proactive IT Support and Why Does It Matter?
How does proactive monitoring differ from reactive support?
Reactive support operates on a simple — and costly — trigger: something breaks, a user complains, and the IT team responds. This model places the burden of problem detection on end users and guarantees that incidents have already caused disruption before anyone addresses them. According to Gartner, the average cost of IT downtime exceeds $5,600 per minute, making the reactive model not just inefficient but financially damaging.
Proactive support, by contrast, shifts detection upstream. Monitoring tools continuously track infrastructure health — server CPU utilization, network latency, application response times, database query performance, and security events. When metrics cross predefined thresholds, the system generates alerts automatically. Integrating these alerts with an ITSM platform then converts them into structured incidents, complete with priority levels, assignment rules, and escalation paths — before any user notices a problem.
Furthermore, proactive support enables problem management rather than just incident management. By identifying recurring alert patterns, IT teams can address root causes rather than repeatedly patching symptoms. This fundamental shift reduces the total volume of incidents over time, freeing IT staff to focus on strategic work.
What are the main components of a proactive monitoring integration?
A successful proactive monitoring integration consists of four interconnected layers working together:
| Layer | Function | Examples |
| Data Collection | Gathers metrics, logs, and events from infrastructure | Nagios, Zabbix, Prometheus, Datadog, SolarWinds |
| Alerting Engine | Evaluates thresholds and triggers alerts | PagerDuty, OpsGenie, built-in alert rules |
| Integration Middleware | Routes alerts to the ITSM platform | Webhooks, REST APIs, native connectors |
| ITSM Workflow | Creates tickets, assigns teams, drives resolution | ManageEngine ITSM, Freshservice |
Each layer must function reliably for the overall system to deliver proactive outcomes. Consequently, platform selection — both for monitoring tools and ITSM — significantly influences how smoothly these layers connect and communicate.
How Does ManageEngine ITSM Handle Monitoring Tool Integrations?
What native monitoring capabilities does ManageEngine offer?
ManageEngine ITSM‘s greatest integration advantage lies in its native ecosystem. OpManager, ManageEngine’s network performance monitoring tool, integrates directly with ServiceDesk Plus to automatically raise incidents when network devices exceed health thresholds. Similarly, Applications Manager monitors web applications, databases, and servers, pushing critical alerts directly into the service desk as structured tickets with pre-populated fields — device name, alert severity, affected service, and timestamp.
This native integration eliminates the data-mapping friction that typically complicates third-party monitoring connections. When OpManager detects a server down event, for example, ServiceDesk Plus immediately creates a P1 incident, notifies the on-call engineer, and starts the SLA clock — all without manual intervention. Moreover, the bidirectional link means that when a technician resolves the incident in ServiceDesk Plus, OpManager acknowledges the alert and stops further escalations.
How does ManageEngine integrate with third-party monitoring tools?
Beyond its native ecosystem, ManageEngine ITSM supports external monitoring tool integration through several methods:
- REST API: External tools post alert data to ServiceDesk Plus via the API, creating or updating incidents programmatically
- Email-to-Ticket: Monitoring tools that send email notifications can route alerts directly to the service desk’s intake mailbox
- Webhooks: Real-time event payloads from tools like Prometheus, Grafana, or Datadog trigger automated ticket creation rules
- SNMP Traps: Network devices broadcast SNMP traps that OpManager captures and escalates to ServiceDesk Plus
- Marketplace Add-ons: Pre-built connectors for Nagios, Zabbix, and SolarWinds simplify configuration significantly
Additionally, ManageEngine’s Business Rules engine allows administrators to define sophisticated routing logic. For instance, a disk space alert from a production database server can automatically create a high-priority incident and assign it to the database team, while the same alert from a dev server creates a low-priority task for the next business day.
What automation workflows can ManageEngine ITSM trigger from monitoring alerts?
Once a monitoring alert reaches ManageEngine ITSM, the platform’s automation engine takes over. Administrators configure Automation Rules that execute predefined actions based on incident attributes. Common automation workflows include:
- Auto-assign incidents to the appropriate support group based on the affected CI (Configuration Item)
- Send SMS and email notifications to on-call engineers immediately upon ticket creation
- Escalate incidents that remain unacknowledged beyond the SLA response window
- Link the new incident to open problems with matching symptoms for root cause correlation
- Trigger change request workflows when recurring incidents suggest infrastructure replacement is needed
- Update the Configuration Management Database (CMDB) to flag affected assets automatically
Furthermore, ManageEngine’s Zia — its AI assistant — can analyze incoming alert patterns and recommend knowledge base articles or similar resolved tickets, helping technicians resolve incidents faster by leveraging institutional knowledge.
How Does Freshservice Handle Monitoring Tool Integrations?
What makes Freshservice’s integration approach distinctive?
Freshservice‘s cloud-native, API-first architecture makes it exceptionally well-suited for modern observability stacks. Unlike platforms designed primarily for on-premise deployment, Freshservice builds integration capabilities into its core rather than treating them as add-ons. The Freshservice Marketplace currently offers over 1,000 apps and integrations, including purpose-built connectors for the most popular monitoring platforms.
Moreover, Freshservice‘s Alert Management module serves as a dedicated landing zone for monitoring alerts. Instead of simply converting every alert directly into a ticket — which can overwhelm teams with noise — Alert Management first correlates incoming alerts, groups related events, and suppresses duplicates before escalating genuine incidents to the service desk. This intelligent filtering dramatically reduces alert fatigue, one of the most significant challenges in large-scale monitoring environments.
Which monitoring tools integrate most effectively with Freshservice?
Freshservice maintains pre-built, marketplace-certified integrations with a wide range of monitoring and observability platforms. The following table summarizes the most widely used combinations:
| Monitoring Tool | Integration Method | Key Capability Enabled |
| Datadog | Native Marketplace app | Auto-ticket creation, alert correlation, metric embedding in tickets |
| Prometheus + Alertmanager | Webhook | Custom alert routing, threshold-based incidents, label-to-field mapping |
| Nagios / Nagios XI | Email + API | Host and service alerts mapped to incidents with CI association |
| New Relic | Native Marketplace app | APM alerts with transaction traces attached to tickets |
| PagerDuty | Bidirectional API | Escalation routing, on-call schedule sync, acknowledgment sync |
| SolarWinds | Webhook / API | Network event correlation, node-down auto-tickets |
| Zabbix | Webhook | Trigger-based incidents with host data pre-populated |
| AWS CloudWatch | Native Marketplace app | Cloud infrastructure alerts with resource tags in tickets |
Additionally, Freshservice‘s Workflow Automator lets administrators design complex, multi-step automation sequences triggered by incoming alerts. These workflows can incorporate conditional logic, parallel actions, time-based triggers, and integrations with external systems — all through a visual drag-and-drop designer that requires no coding expertise.
How does Freshservice’s AI enhance proactive incident management?
Freshservice’s Freddy AI significantly elevates what organizations can achieve through monitoring integrations. When monitoring alerts arrive, Freddy actively contributes to resolution by performing several intelligent actions simultaneously. First, it classifies the incident type and urgency based on patterns from thousands of previously resolved tickets. Next, it searches the knowledge base and suggests relevant resolution steps, reducing the time technicians spend on diagnosis. Furthermore, Freddy’s predictive alerting capabilities can identify degraded performance trends before they breach thresholds — giving teams a window to act before monitoring tools even trigger alerts.
Consequently, organizations that deploy Freshservice with full AI enablement report measurably shorter Mean Time to Resolution (MTTR) and higher first-contact resolution rates. This AI layer transforms the platform from a passive ticket receiver into an active participant in IT operations.
How Do ManageEngine ITSM and Freshservice Compare for Monitoring Integration?

What are the key differences between these two platforms?
Choosing between ManageEngine ITSM and Freshservice for monitoring integration depends on an organization’s specific infrastructure, existing toolset, team capabilities, and strategic direction. The following comparison table examines the most relevant dimensions:
| Dimension |  | |
| Deployment model | On-premise, cloud, and hybrid | Cloud-native SaaS |
| Native monitoring ecosystem | Strong — OpManager, Applications Manager, Log360 | Limited — relies on third-party integrations |
| Third-party integrations | API, webhooks, email, SNMP, marketplace add-ons | 1,000+ Marketplace apps, robust API, webhooks |
| Alert management | Handled within OpManager; mapped to ServiceDesk Plus | Dedicated Alert Management module with correlation |
| AI capabilities | Zia AI for suggestions and predictions | Freddy AI with predictive alerting and auto-classification |
| Automation complexity | High — Business Rules, Automation Rules, workflows | High — Workflow Automator, scenario automations |
| CMDB depth | Comprehensive with asset discovery | Strong, with auto-discovery and CI relationships |
| Ease of integration setup | Moderate — richer config options but more complexity | High — marketplace apps simplify common integrations |
| Pricing model | Per-technician or per-node; perpetual or subscription | Per-agent subscription; tiered feature plans |
| Best suited for | Mid-to-large enterprises with complex on-prem infrastructure | Cloud-first and hybrid organizations prioritizing agility |
| Mobile support | Available via native apps | Strong mobile-first design philosophy |
| Reporting and analytics | Advanced built-in reporting, custom dashboards | Strong analytics with Freddy Insights |
Neither platform is universally superior. Rather, ManageEngine ITSM excels when organizations operate complex on-premise infrastructure and want tight native integration between monitoring and service management. Freshservice leads when teams prioritize ease of integration, cloud-native scalability, and AI-driven automation. Consequently, the right choice depends heavily on organizational context rather than platform rankings alone.
What Are the Best Practices for Implementing Monitoring Integrations?

How should organizations plan a monitoring-to-ITSM integration project?
Successful monitoring integrations rarely happen through trial and error. Instead, organizations that achieve the best outcomes follow a deliberate planning and implementation process. The following steps outline a proven approach:
- Audit existing monitoring tools: Catalog every monitoring solution currently in use, noting which systems they cover, how they generate alerts, and what data they provide
- Define alert taxonomy: Establish clear criteria for alert severity levels (P1 through P4) so that monitoring thresholds map consistently to ITSM ticket priorities
- Identify integration methods: Determine whether each monitoring tool connects via native connector, API, webhook, or email — and document the data fields each method provides
- Design ticket templates: Create standardized incident templates pre-populated with monitoring-derived fields to ensure technicians receive complete context immediately
- Build automation rules: Define routing, notification, and escalation logic before going live to prevent alert floods from overwhelming the service desk
- Test with real alert scenarios: Simulate common incidents in a staging environment to validate that alerts reach the right teams with the right data
- Train support staff: Ensure technicians understand how to interpret monitoring-generated tickets and how to acknowledge or close alerts in the monitoring tool
- Monitor and refine: Review alert volumes, false positive rates, and MTTR metrics weekly for the first month and adjust thresholds and rules accordingly
How can organizations avoid alert fatigue during integration?
Alert fatigue — the state where IT teams become desensitized to notifications because of excessive volume — represents the single greatest risk in monitoring integration projects. Poorly configured integrations can generate hundreds of tickets per day from a single infrastructure event, burying genuine critical incidents under mountains of noise.
Both ManageEngine ITSM and Freshservice provide tools to combat this problem. Freshservice’s Alert Management module explicitly correlates related alerts before creating incidents, collapsing dozens of related events into a single ticket. ManageEngine’s Business Rules allow administrators to suppress low-priority alerts during maintenance windows or to require multiple consecutive threshold breaches before raising an incident.
Furthermore, organizations should implement alert dependency mapping — the practice of identifying which monitoring alerts naturally cascade from a single root cause. For example, when a core network switch fails, dozens of downstream alerts may follow. Mapping these dependencies ensures the ITSM platform creates one parent incident rather than fifty child tickets.
What Business Outcomes Does Proactive Monitoring Integration Deliver?
What measurable improvements do organizations typically achieve?
Organizations that successfully integrate monitoring tools with their ITSM platforms consistently report improvements across multiple operational dimensions. Research from industry analysts and platform case studies highlights the following typical outcomes:
| Metric | Typical Improvement | Enabling Mechanism |
| Mean Time to Detect (MTTD) | 60–80% reduction | Automated alert-to-ticket conversion eliminates manual detection lag |
| Mean Time to Resolve (MTTR) | 30–50% reduction | Pre-populated tickets with monitoring context accelerate diagnosis |
| False positive ticket volume | 40–70% reduction (post-tuning) | Alert correlation and threshold refinement eliminate noise |
| SLA compliance rate | 15–25% improvement | Automated prioritization and routing ensure timely response |
| IT staff productivity | 20–35% improvement | Reduced manual triage time allows focus on complex problems |
| End-user satisfaction | 10–20% improvement | Faster resolution and proactive communication improve experience |
These figures reflect organizations that invest in proper integration design, alert tuning, and continuous improvement — not just the initial setup. Moreover, the compounding nature of proactive support means that benefits grow over time as teams accumulate data, refine thresholds, and build institutional knowledge through the ITSM platform.
What Are the Key Conclusions About Monitoring Integration for Proactive Support?
The evidence is clear: integrating monitoring tools with an enterprise ITSM platform fundamentally transforms IT support from a reactive, user-driven function into a proactive, data-driven operation. Organizations that make this transition detect incidents faster, resolve them more efficiently, and prevent a significant proportion from ever reaching end users.
Throughout this article, we have seen how both ManageEngine ITSM and Freshservice provide powerful, distinct pathways to proactive monitoring integration. ManageEngine ITSM excels through its native ecosystem — offering tight, out-of-the-box connections between OpManager, Applications Manager, and ServiceDesk Plus that deliver unified visibility across on-premise infrastructure. Freshservice, meanwhile, leads in cloud-native extensibility, with its Marketplace, Alert Management module, and Freddy AI combining to make intelligent, automated incident management accessible to teams of every size.
Ultimately, platform selection matters less than implementation quality. The most sophisticated ITSM platform delivers limited value if monitoring integrations generate alert noise, miscategorize incidents, or fail to route events to the right teams. This is precisely why partnering with Solution for Guru makes such a measurable difference. Their platform-specific expertise, structured methodology, and commitment to long-term client success ensure that monitoring integrations deliver the proactive outcomes they promise — faster detection, intelligent automation, and an IT operation that stays ahead of problems rather than chasing them.
Frequently Asked Questions
Yes — both ManageEngine ITSM and Freshservice support integration with open-source monitoring tools. Prometheus integrates with Freshservice via the Alertmanager webhook, which sends alert payloads to Freshservice’s inbound email or API endpoint. Zabbix connects to both platforms through webhook actions configured in Zabbix’s media types, triggering incident creation whenever a problem event occurs. ManageEngine additionally supports Zabbix and Nagios through dedicated add-ons available in its integration catalog. For both platforms, organizations typically need to configure field mapping — translating Prometheus labels or Zabbix macro values into the correct ITSM ticket fields. Solution for Guru regularly handles this mapping work as part of its integration configuration services.
Integration timelines vary significantly based on the number of monitoring sources, the complexity of routing rules, and the depth of automation required. A basic single-source integration — for example, connecting Datadog to Freshservice using the Marketplace app — can go live in a few hours. A comprehensive multi-source integration covering five or more monitoring tools, with custom field mapping, CMDB linking, alert correlation rules, and advanced automation workflows, typically requires two to six weeks of planned project work.
Alert fatigue occurs when IT teams receive so many notifications that they begin ignoring or delaying responses — including to genuine critical incidents. Research from industry studies indicates that IT professionals routinely ignore a significant percentage of monitoring alerts simply because the volume makes triage impossible. Both ManageEngine ITSM and Freshservice address this directly. Freshservice’s Alert Management module correlates related alerts before ticket creation, collapsing event storms into single incidents. ManageEngine’s Business Rules suppress redundant alerts, enforce alert dependencies, and apply time-based filters that prevent maintenance windows from generating spurious tickets. Additionally, both platforms support alert threshold tuning — working with the monitoring tool’s configuration to ensure that only genuinely actionable conditions reach the service desk.
Why Should You Choose Solution for Guru as Your ITSM Integration Partner?
What expertise does Solution for Guru bring to monitoring integration projects?
Solution for Guru is a specialized IT service management consulting and implementation company with deep expertise in both ManageEngine ITSM and Freshservice. Rather than offering generic IT consulting, the team focuses exclusively on helping organizations extract maximum value from their ITSM platforms — including the complex work of integrating monitoring tools into structured, intelligent service management workflows.
Specifically, Solution for Guru delivers the following services for monitoring integration projects:
- ITSM Platform Assessment: Evaluate your current ManageEngine or Freshservice configuration to identify integration gaps and optimization opportunities
- Monitoring Stack Analysis: Review your existing monitoring tools and determine the optimal integration path for each — native connector, API, webhook, or SNMP
- Integration Architecture Design: Design the complete data flow from monitoring alert to ITSM incident, including field mapping, priority logic, and routing rules
- Implementation and Configuration: Execute the technical integration work, including webhook configuration, API connections, automation rule setup, and CMDB linking
- Alert Tuning and Optimization: Refine monitoring thresholds and ITSM filtering rules post-launch to minimize noise and maximize signal quality
- Training and Knowledge Transfer: Equip your IT operations and service desk teams to manage, extend, and troubleshoot the integrated system independently
- Ongoing Support and Evolution: Provide continuous improvement services as your infrastructure and ITSM requirements grow
How does Solution for Guru reduce the risks of complex ITSM integration projects?
ITSM integration projects carry well-documented risks: alert floods on day one, misconfigured routing that misdirects critical incidents, and user adoption failures that leave expensive platforms underutilized. Solution for Guru systematically addresses each of these risks through its structured delivery methodology.
First, Solution for Guru conducts a comprehensive discovery phase before any technical work begins, aligning stakeholders on goals, success metrics, and risk tolerance. Next, the team implements integrations in controlled phases — starting with a single monitoring source, validating outcomes, and expanding progressively. This approach prevents the overwhelming integration failures that plague rushed, all-at-once deployments.
Additionally, Solution for Guru‘s certified expertise in both ManageEngine ITSM and Freshservice means clients receive platform-specific guidance that general IT integrators cannot provide. The team knows which configurations cause long-term maintenance headaches, which integration patterns scale poorly, and which automation rules deliver consistent results — knowledge gained through real-world implementation experience rather than documentation alone.
What specific benefits do Solution for Guru clients experience?
| Benefit | Detail |
| Faster time-to-value | Proven implementation templates accelerate deployment and avoid common configuration pitfalls |
| Reduced integration complexity | Expert architecture design produces clean, maintainable integrations that the internal team can own confidently |
| Lower total cost of ownership | Efficient configuration minimizes post-launch rework and platform underutilization |
| Higher automation adoption | Guided automation design ensures teams actually use the workflows built, rather than bypassing them |
| Platform-certified expertise | Dedicated ManageEngine and Freshservice knowledge that generic consultancies cannot match |
| Scalable integration design | Architecture built to accommodate new monitoring tools and ITSM expansions without redesign |
| Committed partnership | Long-term support relationship that evolves alongside your IT operations maturity |
Recommended:
- Freshservice Asset Management vs ManageEngine Asset Discovery
- On-Premise vs Cloud ITSM: Choosing Between ManageEngine and Freshservice Architectures
- Freshservice for Internal IT Support: What Problems Does It Solve?
- How Does Freshservice Simplify IT Service Management for Modern Organizations?
- How Do Businesses Integrate Slack and Microsoft Teams with ITSM Platforms?
- Automating Software License Tracking with ITSM Solutions: How Can You Take Control?
- Best Microsoft 365 Integrations for ManageEngine and Freshservice
- Integrating Endpoint Management Tools with ITSM Systems
- Aligning ITSM Processes with ISO 20000 Standards
- How Long Does an ITSM Implementation Really Take? Key Factors Explained
- ManageEngine vs Freshservice
- Top ITSM Best Practices Using ManageEngine
- Improving IT Governance and Compliance with ManageEngine ITSM
- Cloud vs On-Premise ManageEngine ITSM: Which Should You Choose?
- Integrating ManageEngine with Microsoft 365