What Reporting and Dashboard Strategies Do High-Performing ITSM Leadership Teams Actually Use?

IT service management leaders face a persistent challenge: they manage vast amounts of operational data — ticket volumes, resolution times, SLA compliance rates, change success ratios — yet they often struggle to translate that data into the clear, actionable intelligence their boards and business unit leaders demand. The gap between raw ITSM data and genuine leadership insight costs organizations real money, erodes stakeholder confidence, and delays the process improvements that keep IT operations running smoothly.
The solution isn’t more data. It’s a deliberate reporting and dashboard strategy built on the right ITSM platform, connected to the right KPIs, and designed around the specific decisions that IT leaders need to make every week. In this guide, we’ll walk through exactly how ITSM leadership teams build that strategy — and how platforms like ManageEngine and Freshservice deliver the reporting infrastructure to make it real.
Table of contents
Quick Summary
- Effective ITSM reporting aligns with four leadership layers: operational, tactical, strategic, and executive — each requiring different metrics and dashboard formats.
- ManageEngine ServiceDesk Plus provides enterprise-grade reporting with customizable dashboards, SLA tracking, and deep ITIL process coverage.
- Freshservice delivers intuitive analytics with AI-assisted insights, making it especially strong for teams that want fast, visual reporting without heavy configuration.
- Key ITSM KPIs for leadership include: MTTR, FCR, SLA compliance rate, change success rate, and cost per ticket.
- The most successful ITSM dashboards separate operational monitoring from strategic decision-making views — avoiding the common trap of showing executives the same metrics as frontline analysts.
- Working with Solution for Guru accelerates ITSM reporting implementation and ensures dashboards genuinely serve leadership needs.
54% of IT leaders report inadequate visibility into service performance, per HDI research
3× more likely to meet SLA targets when organizations use real-time ITSM dashboards
$5.6T global IT spending in 2025, underscoring the need for accountable ITSM reporting (Gartner)
How Are ManageEngine and Freshservice Central to ITSM Reporting Strategy?
Before exploring reporting frameworks and dashboard design principles, it’s worth understanding exactly how the two platforms we reference throughout this guide relate to the topic — and why they represent the leading choices for ITSM leadership reporting today.
ManageEngine ServiceDesk Plus
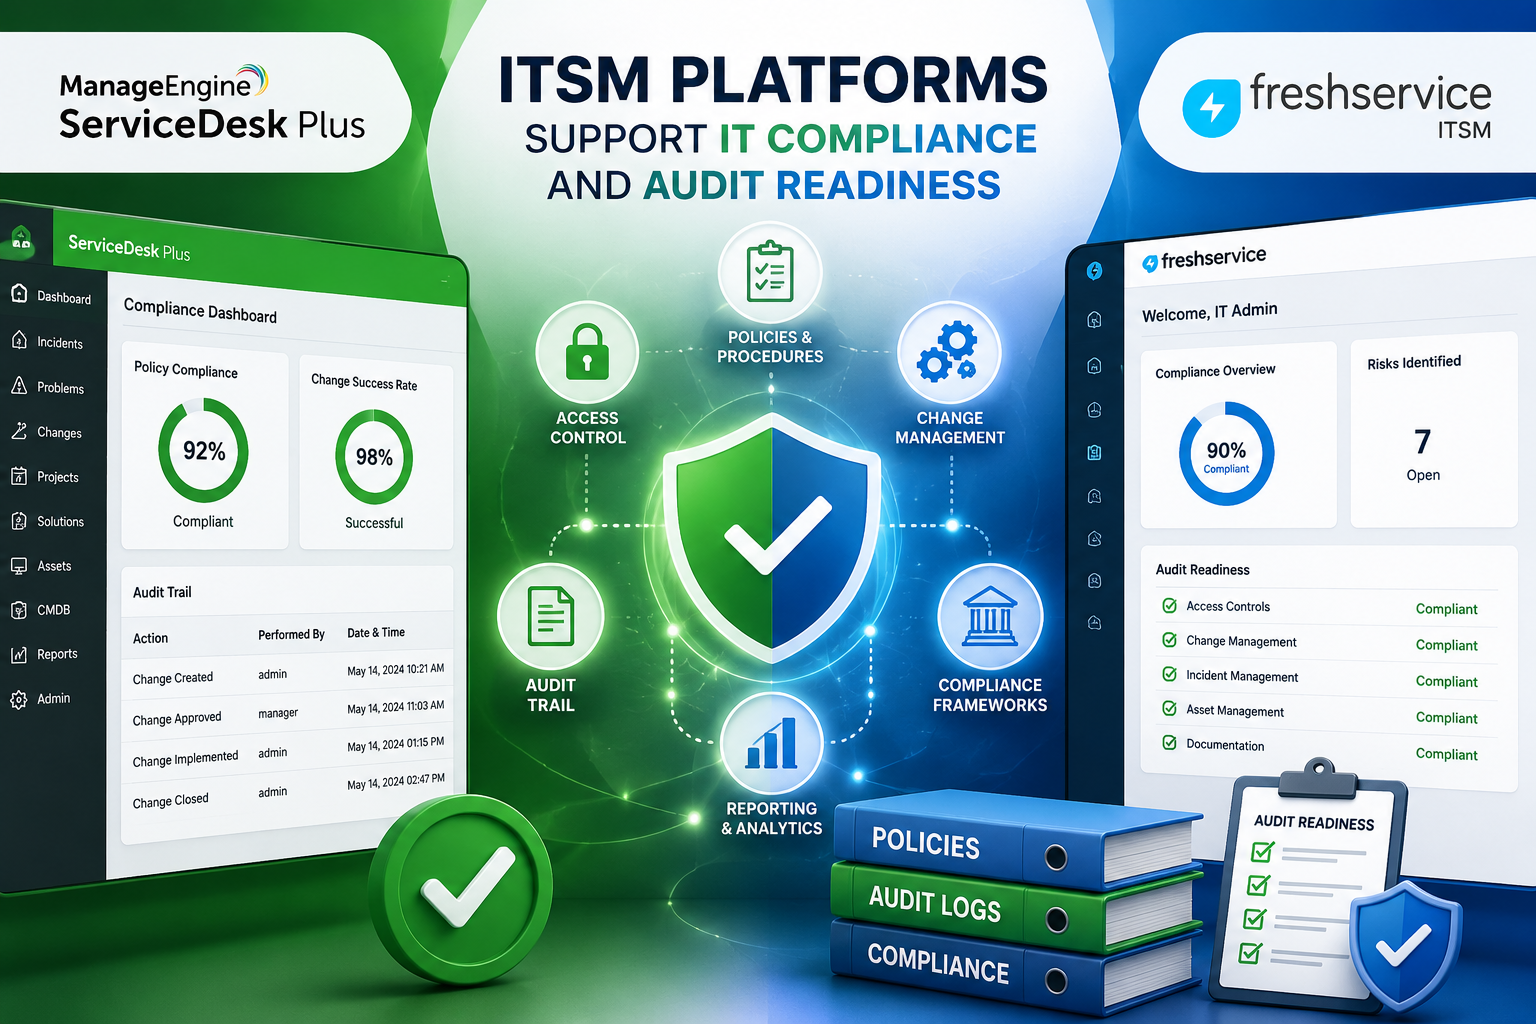
ManageEngine ServiceDesk Plus, developed by Zoho Corporation’s ManageEngine division, delivers a comprehensive ITSM platform with one of the most configurable reporting engines in the market. It supports incident, problem, change, asset, and release management — and provides leadership teams with over 150 built-in reports alongside a fully customizable dashboard builder. Its ITIL v4-aligned process framework makes it a natural fit for mature IT organizations that need to demonstrate compliance and process adherence to auditors and executives alike.Explore ManageEngine →
Freshservice

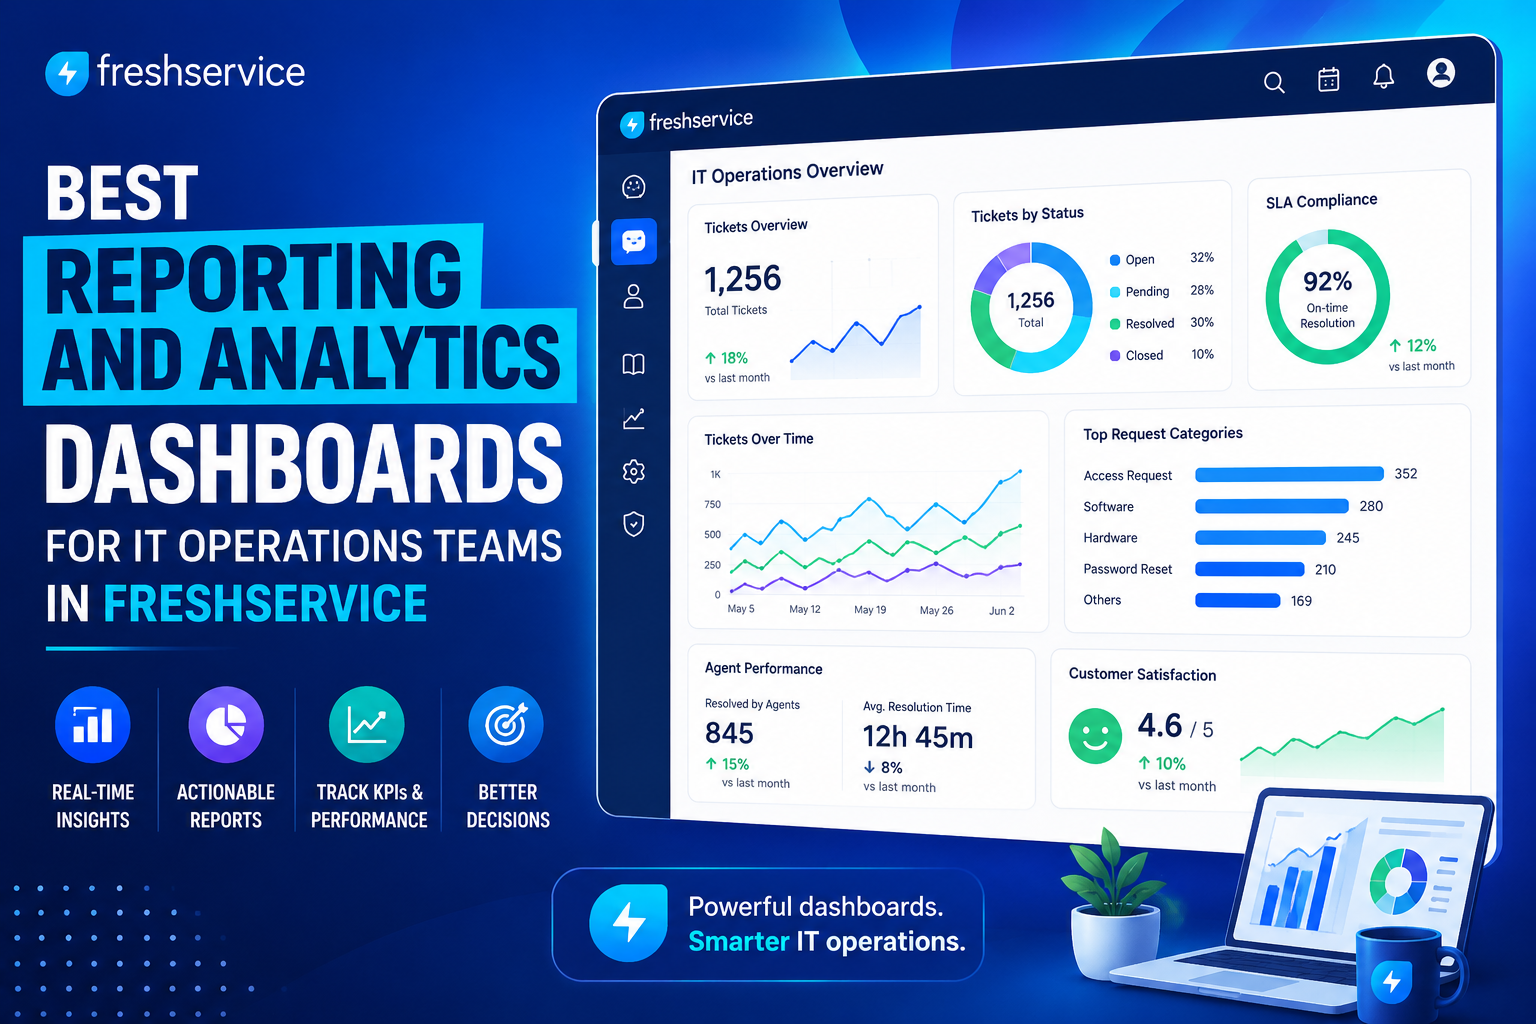
Freshservice, developed by Freshworks, takes a cloud-native, AI-first approach to ITSM reporting. Its Analytics module provides pre-built leadership dashboards, custom report builders, and AI-generated trend summaries that surface insights without requiring manual data analysis. Freshservice particularly excels for ITSM leadership teams that prioritize speed-to-insight and want visually compelling dashboards that communicate clearly to non-technical business stakeholders — a growing priority as IT leaders present increasingly to board-level audiences.Explore Freshservice →
Together, ManageEngine and Freshservice represent the two dominant approaches to enterprise ITSM reporting: deep configurability and ITIL process rigor on one side, and modern AI-assisted analytics with rapid deployment on the other. Understanding both platforms’ reporting capabilities helps leadership teams select the approach that fits their organization’s maturity level, team size, and strategic reporting goals.
What Reporting Framework Do ITSM Leadership Teams Actually Need?
Why Does a Single Dashboard Fail Every Audience Simultaneously?
One of the most common and costly ITSM reporting mistakes is building a single, all-inclusive dashboard and sharing it with every stakeholder — from service desk analysts to the CIO. This approach fails everyone. Analysts need real-time ticket queue data. Service desk managers need team performance metrics. IT directors need SLA trend analysis. And the CIO needs business outcome metrics that connect IT performance to organizational value.
Forcing all of these audiences to extract their specific signals from the same cluttered dashboard creates confusion, erodes trust in the reporting system, and — critically — fails to drive the decisions it was designed to support. According to AXELOS, the organization behind the ITIL framework, effective service reporting requires tailoring the content, frequency, and format of reports to the specific needs of each audience in the service value chain.
What Are the Four Reporting Layers Every ITSM Leader Should Implement?
High-performing ITSM organizations structure their reporting across four distinct layers, each serving a different decision-making altitude:
- Operational Layer (Real-Time): Live dashboards for service desk analysts and team leads — ticket queue status, open priority incidents, agent workload distribution, and current SLA breach risk. Both ManageEngine and Freshservice provide real-time operational views that update every few minutes.
- Tactical Layer (Weekly): Performance trend reports for service desk managers — resolution time trends, first contact resolution rates, recurring incident patterns, and team productivity metrics. This layer drives weekly operational decisions about staffing, training, and process adjustments.
- Strategic Layer (Monthly): Cross-process analysis for IT directors — SLA compliance trends across all service categories, change success rates, problem management effectiveness, and cost-per-ticket trends. This layer informs quarterly planning and budget allocation decisions.
- Executive Layer (Quarterly): Business outcome dashboards for CIOs and IT steering committees — IT availability vs. business impact, user satisfaction trends (CSAT), IT spend per business unit, and service improvement velocity. This layer connects ITSM performance to organizational value.
Framework in Practice: ManageEngine ServiceDesk Plus supports all four layers through its role-based dashboard system — different dashboard views can be configured and assigned to different user roles, ensuring that each stakeholder automatically sees the layer appropriate to their function. Freshservice achieves similar segmentation through its Analytics workspace, where report collections can be organized and shared by audience group.
Which KPIs Should ITSM Leadership Teams Prioritize in Their Dashboards?

What Are the Tier-One Metrics Every ITSM Leader Must Track?
Before examining platform-specific reporting capabilities, leadership teams need clarity on which metrics genuinely matter. According to HDI’s State of the Service Desk research, organizations that consistently track a focused set of 8–12 KPIs outperform those tracking 30+ metrics — because fewer, better-understood metrics drive faster, more confident decisions.
The essential tier-one KPIs for ITSM leadership dashboards include:
| KPI | Definition | Why It Matters to Leadership | Target Benchmark |
|---|---|---|---|
| MTTR (Mean Time to Resolve) | Average time from ticket creation to resolution | Directly measures service speed and operational efficiency | Varies by priority; P1 typically <4 hours |
| FCR (First Contact Resolution Rate) | % of tickets resolved at first point of contact without escalation | Reflects team capability and knowledge base effectiveness | Industry avg: 74% (HDI 2023) |
| SLA Compliance Rate | % of tickets resolved within agreed SLA timeframes | Core contractual and business commitment metric | >95% for most enterprise agreements |
| Change Success Rate | % of changes implemented without incident or rollback | Measures change management process maturity | >95% (ITIL benchmark) |
| CSAT Score | User satisfaction rating from post-ticket surveys | Captures user experience beyond technical resolution metrics | >4.2/5.0 or >85% positive |
| Cost Per Ticket | Total service desk cost divided by ticket volume | Enables efficiency benchmarking and budget justification | Avg $22 per ticket (MetricNet 2023) |
| Ticket Backlog | Number of open tickets older than defined threshold | Early warning signal for capacity and process issues | <10% of monthly volume |
| Problem Recurrence Rate | % of incidents linked to known, unresolved problems | Measures effectiveness of problem management in preventing repeat incidents | Declining trend year-over-year |
How Do ManageEngine and Freshservice Track These KPIs Natively?
Both platforms track all eight tier-one KPIs out of the box, but they surface this data differently — which matters significantly for adoption and usability at the leadership level.
ManageEngine ServiceDesk Plus provides dedicated report categories for each ITIL process area — incident management reports, change management reports, SLA reports, and asset reports each contain pre-built views of the relevant KPIs. The platform’s Report Builder allows leaders to create custom cross-process reports that combine KPIs from multiple categories, such as a single report showing both SLA compliance and CSAT trends for a specific business unit. Furthermore, ManageEngine’s scheduled report delivery sends these reports automatically to leadership inboxes on defined schedules — weekly, monthly, or at custom intervals.
Freshservice takes a more visual and AI-assisted approach. Its Analytics module includes pre-built KPI widgets that leadership teams add to dashboards with a single click, and its Freddy AI engine surfaces anomaly alerts — for example, automatically flagging when MTTR increases by more than 15% compared to the previous week’s average. This proactive alerting capability means that IT directors receive warning signals before they manually check reports, shifting the reporting paradigm from reactive review to proactive management.
How Do You Design ITSM Dashboards That Drive Decisions Rather Than Just Display Data?
What Principles Separate an Effective Leadership Dashboard From a Data Dump?
Most ITSM dashboards fail not because of data quality problems, but because of design problems. They display too many metrics, use inconsistent color coding, mix operational noise with strategic signals, and present numbers without context or trend lines. An IT director scanning a 30-widget dashboard in a 10-minute leadership meeting cannot extract actionable intelligence — so they stop trusting the dashboard entirely.
Effective ITSM leadership dashboards follow five core design principles:
- Ruthless prioritization: Limit executive dashboards to 6–8 metrics maximum. Every metric earns its place by answering a specific leadership question — if it doesn’t drive a decision, remove it.
- Trend context over point-in-time values: A CSAT score of 4.1 means nothing without context. Is it improving or declining? Show 13-week rolling trends alongside current values so leaders immediately understand direction, not just state.
- Red/amber/green (RAG) status indicators: Color-coded thresholds transform numbers into immediate signals. Leadership teams process visual alerts far faster than they parse numerical tables during meetings.
- Drill-down capability: Executive dashboards should summarize; clicking any metric should immediately reveal the underlying detail. Both ManageEngine and Freshservice support hierarchical drill-down so leaders can investigate anomalies without requiring a separate report request.
- Business language, not IT jargon: Replace technical acronyms with business-outcome language on executive dashboards. “Unplanned downtime impact” communicates more effectively to a CFO than “P1 incident volume.”
How Does ManageEngine ServiceDesk Plus Support Executive Dashboard Design?
ManageEngine ServiceDesk Plus provides a drag-and-drop dashboard builder that allows ITSM leaders to compose role-specific views from a library of pre-built widgets. Each widget connects live to the ServiceDesk database, ensuring dashboards always reflect current data without manual refresh. Key executive dashboard capabilities include:
- Homepage customization per user role: Every user role — technician, manager, executive — sees a different default dashboard upon login, tailored to their reporting layer.
- Flash Reports: ManageEngine’s Flash Reports feature provides a one-click visual summary of key performance indicators in a presentation-ready format, designed specifically for leadership review meetings.
- Embedded analytics: ManageEngine integrates with ManageEngine Analytics Plus, which extends dashboard capabilities with advanced data visualization, predictive trend modeling, and cross-module reporting that combines service desk data with IT asset and network performance data.
- Scheduled email delivery: Dashboards and reports can be scheduled for automatic PDF or CSV delivery to any distribution list — ensuring leadership receives consistent reporting without logging into the system.
How Does Freshservice’s Analytics Module Enable Leadership Reporting?
Freshservice Analytics delivers one of the most visually compelling reporting experiences available in the ITSM market. Its interface uses a familiar BI-tool style — similar to Tableau or Power BI — which means IT leaders with business intelligence backgrounds find it immediately intuitive without training overhead.
Freshservice Analytics provides several capabilities that specifically serve leadership needs:
- Pre-built executive report templates: Freshservice ships with ready-made leadership reports covering incident trends, SLA performance, agent productivity, and change management outcomes — eliminating the configuration time that slows deployment in other platforms.
- Benchmark comparisons: Freshservice’s analytics can display your organization’s KPI performance against industry benchmarks, giving leadership a competitive context for their service performance data.
- Freddy AI anomaly detection: Freshservice’s AI engine monitors all KPI trends continuously and pushes alerts when values deviate significantly from expected patterns — proactively surfacing issues before they appear in scheduled reports.
- Multi-department filtering: For enterprises with multiple business units, Freshservice Analytics filters all dashboards by department, location, or service category — allowing CIOs to slice portfolio-level data by business unit with a single click.
Dashboard Design Tip: Build your first executive dashboard directly from a stakeholder interview, not a feature list. Ask your CIO or IT director: “What three questions do you need answered every Monday morning?” Design the dashboard to answer exactly those questions — nothing more, nothing less. Add complexity only when a clear decision need emerges.
How Should ITSM Leaders Build SLA Reporting That Drives Accountability?

Why Do Most SLA Reports Fail to Create Behavioral Change?
SLA reporting is the most common form of ITSM reporting — and arguably the least effective at driving improvement in most organizations. The typical SLA report shows compliance percentages by ticket category at the end of the month. By the time leaders review it, the month is over, the breaches are historical facts, and no one feels personally accountable for the numbers.
Effective SLA reporting creates accountability by shifting from retrospective to predictive framing. Rather than reporting on SLA breaches after they occur, leadership teams build reporting systems that flag SLA breach risk in real time — giving service desk managers and team leads the opportunity to intervene before a breach becomes a statistic.
Both ManageEngine and Freshservice support predictive SLA alerting. ManageEngine ServiceDesk Plus generates automated escalation notifications when tickets approach their SLA deadline — alerting the assigned technician, their manager, and defined leadership contacts at configurable thresholds (for example, at 75% and 90% of SLA elapsed time). Freshservice’s SLA dashboard provides a live view of all tickets in breach risk status, color-coded by urgency, enabling service desk managers to reprioritize queue assignments in real time.
How Do You Structure SLA Reporting for Multi-Tier Service Agreements?
Enterprise organizations typically operate with differentiated SLA tiers — different resolution time commitments for different business units, user groups, or service categories. A priority-one incident for a trading floor system demands a 1-hour response; a password reset for a back-office user accepts a 4-hour resolution time. Mixing these tiers in aggregate SLA reports produces misleading compliance numbers that obscure where real performance gaps exist.
Effective multi-tier SLA reporting in ManageEngine and Freshservice requires:
- Define separate SLA policies in your ITSM platform for each service tier, business unit, and priority level — avoid a single catch-all SLA.
- Build separate compliance views for each SLA tier in your leadership dashboard — never aggregate compliance across tiers in a single percentage figure.
- Create trend reports for each tier showing 13-week rolling compliance, so leadership identifies whether a tier is improving, stable, or deteriorating over time.
- Link each SLA tier to a named accountable owner — a specific service area manager whose name appears alongside the compliance data. Named accountability transforms SLA reporting from a measurement exercise into a performance management tool.
- Review SLA tier performance in monthly leadership meetings using Freshservice’s or ManageEngine’s shareable dashboard links, so all attendees view the same live data rather than a pre-prepared slide deck that may already be outdated.
How Does Reporting on Change and Problem Management Elevate ITSM Maturity?
Why Do Leadership Teams Overlook Change Management Reporting?
Incident reporting receives the most attention in most ITSM organizations — it’s immediate, visible, and emotionally charged. Change management reporting, by contrast, tends to receive far less leadership scrutiny despite having an equally direct impact on service stability. According to Gartner’s ITSM research, approximately 80% of unplanned downtime in enterprise environments traces back to change-related failures — making change management reporting arguably the highest-ROI reporting investment an ITSM leader can make.
ManageEngine ServiceDesk Plus provides a dedicated Change Management module with built-in reporting on change success rates, rollback frequencies, unauthorized change rates, and change category distribution. These reports help leadership evaluate the risks associated with different types of changes. For example, they can show whether infrastructure, application, or security changes are more likely to cause issues. The reports also help determine whether the Change Advisory Board (CAB) is reviewing changes thoroughly enough. This allows organizations to assess whether their change management process meets enterprise governance requirements.
How Should Problem Management Reporting Connect to Incident Trends?
Problem management reports highlight the proactive value of the ITSM team. They show how effectively the team identifies the root causes of issues. Instead of repeatedly fixing the same incidents, the team works to eliminate the underlying problems. This reduces the likelihood of recurring incidents and improves long-term service stability. Unfortunately, most organizations report on problem management in isolation, missing the most compelling story: the direct relationship between problem resolution and incident volume reduction.
Effective problem management reporting in both ManageEngine and Freshservice connects problem resolution data to incident trend data, enabling leadership to quantify the impact of proactive work. A compelling leadership report might show:
- A specific known error record created in Month 1
- The permanent fix implemented in Month 2
- A 40% reduction in related incident volume in Month 3
- The estimated cost savings from eliminated incidents over the subsequent quarter
This narrative format — connecting IT activities to measurable business outcomes — transforms problem management from an internal process discipline into a visible, quantifiable source of organizational value. Furthermore, it gives ITSM leaders compelling evidence for investment in proactive capabilities when budget discussions arise.
How Do ManageEngine and Freshservice Compare for ITSM Leadership Reporting?

The table below provides a detailed comparison of both platforms’ reporting and dashboard capabilities, helping ITSM leadership teams identify which platform best aligns with their organization’s needs:
| Feature / Capability | ||
|---|---|---|
| Built-in Report Library | 150+ pre-built reports across all ITIL modules | 100+ pre-built reports with AI-generated insights |
| Dashboard Builder | ✔ Drag-and-drop; role-based dashboard assignment | ✔ BI-style interface; widget library; shareable links |
| Real-Time Data Refresh | ✔ Live data; configurable refresh intervals | ✔ Near real-time; AI anomaly alerts |
| AI-Assisted Insights | ! Available via ManageEngine Analytics Plus add-on | ✔ Native Freddy AI anomaly detection and trend summaries |
| Executive Report Templates | ✔ Flash Reports for leadership-ready summaries | ✔ Pre-built executive dashboards for CIOs |
| Scheduled Report Delivery | ✔ Email delivery (PDF/CSV) on any schedule | ✔ Email delivery with dashboard snapshots |
| SLA Breach Prediction | ✔ Escalation at configurable SLA % thresholds | ✔ Live SLA risk dashboard with color-coded alerts |
| Multi-Department Filtering | ✔ Filter by department, group, technician | ✔ One-click business unit and location filtering |
| Change Management Reports | ✔ Full CAB reporting; change success rate tracking | ✔ Change analytics with risk assessment reporting |
| Problem Management Reports | ✔ Root cause analysis; known error tracking | ✔ Problem trend analysis linked to incident data |
| Third-Party BI Integration | ✔ Analytics Plus; REST API for Power BI / Tableau | ✔ REST API; native Freshworks Analytics connector |
| Deployment Model | Cloud and on-premise options | Cloud-native only |
| Best For | Mature ITIL organizations; complex multi-module reporting | Fast deployment; AI-powered insight; modern UX |
| Get Started | Visit ManageEngine → | Visit Freshservice → |
How Do ITSM Leadership Teams Roll Out a Reporting Strategy Without Disrupting Operations?
What Does a Phased Reporting Implementation Look Like in Practice?
The most common implementation mistake ITSM teams make is attempting to build all four reporting layers simultaneously. Designing executive dashboards while simultaneously configuring operational real-time views and tactical weekly reports creates scope creep, extends timelines, and often results in a reporting system that satisfies no audience fully. A phased approach delivers value faster and builds organizational confidence in the reporting infrastructure incrementally.
Here’s a proven phased implementation roadmap for ITSM reporting using either ManageEngine or Freshservice:
- Phase 1 — Operational Foundation (Weeks 1–3): Configure real-time ticket queue dashboards for service desk analysts and team leads. Establish RAG status thresholds for SLA breach risk. Deploy automated SLA escalation alerts. Validate that live data accuracy meets expectations.
- Phase 2 — Tactical Reporting (Weeks 4–6): Build weekly KPI trend reports for MTTR, FCR, SLA compliance, and ticket volume. Schedule automated delivery to service desk managers every Monday morning. Establish the first cross-process report linking incident volume to known problem trends.
- Phase 3 — Strategic Dashboards (Weeks 7–10): Design monthly strategic dashboards for IT directors covering SLA compliance trends, change success rates, and cost-per-ticket analysis. Integrate with HR/HRIS for resource cost data where applicable. Connect ManageEngine Analytics Plus or Freshservice’s external API to your existing BI platform if required.
- Phase 4 — Executive Reporting (Weeks 11–14): Build the executive-layer dashboard in business-outcome language. Present the first quarterly leadership review using live Freshservice or ManageEngine dashboard data rather than a manually prepared slide deck. Collect stakeholder feedback and refine the dashboard based on the questions leadership actually asks during the review.
- Phase 5 — Continuous Improvement (Ongoing): Establish a quarterly dashboard review cycle. Add, remove, or modify metrics based on evolving strategic priorities. Use ManageEngine’s or Freshservice’s trend data to build year-over-year benchmarking reports that demonstrate ITSM improvement velocity to executive sponsors.
Implementation Tip:
Schedule a 30-minute “dashboard walkthrough” session with each audience group — service desk analysts, managers, directors, and executives — before finalizing each phase. Direct feedback from actual users consistently reveals that the metrics leadership teams assume are important differ significantly from those that actually drive decisions in practice.
What Should ITSM Leadership Teams Take Away From This Guide?
Reporting and dashboard strategy is not a configuration task — it’s a strategic discipline that directly determines how well an IT organization translates its operational performance into business value. The most successful teams tend to have three things in common. First, they tailor their reports to different audiences and levels of decision-making. This ensures that each stakeholder receives information that is relevant to their role. Second, they focus on trends over time rather than relying solely on current metrics. This helps them identify patterns and make better-informed decisions. Third, they use ITSM platforms with robust reporting capabilities. As their processes become more sophisticated, these platforms can continue to support their growing reporting needs.
ManageEngine ServiceDesk Plus delivers exceptional value for ITSM organizations with mature ITIL process implementations, complex multi-module reporting needs, or requirements for on-premise deployment. Its 150+ pre-built reports, Flash Reports feature, and deep integration with ManageEngine Analytics Plus provide a reporting foundation capable of satisfying the most demanding enterprise governance requirements. For organizations with established IT process frameworks that need to scale their reporting sophistication, ManageEngine represents a powerful, proven choice. Explore ManageEngine ServiceDesk Plus here.
Freshservice delivers exceptional value for organizations prioritizing speed-to-insight, modern UX, and AI-assisted anomaly detection that proactively surfaces issues before manual review cycles catch them. Its pre-built executive dashboard templates, Freddy AI intelligence layer, and BI-style analytics interface enable ITSM leadership teams to deploy compelling, data-driven reporting in weeks rather than months. For organizations modernizing their ITSM stack or launching ITSM reporting capabilities for the first time, Freshservice provides the fastest path to leadership-grade insights. Explore Freshservice analytics here.
Frequently Asked Questions About ITSM Reporting and Dashboard Strategy
The update frequency for ITSM dashboards should match the decision-making cadence of each audience layer. Operational dashboards for service desk analysts need real-time or near-real-time data — both ManageEngine and Freshservice support refresh intervals measured in minutes for operational views. Tactical dashboards for service desk managers work best on a weekly review cycle, ideally delivered automatically every Monday morning via scheduled report. Strategic dashboards for IT directors align with monthly operational reviews, while executive dashboards serve quarterly business reviews. As a broader principle, the ITIL guidance on service reporting recommends that organizations review the continued relevance of every recurring report at least annually — eliminating reports that no longer drive decisions and replacing them with metrics that reflect current strategic priorities.
Yes — both platforms provide REST APIs that enable data export to external business intelligence platforms including Microsoft Power BI, Tableau, Qlik, and Google Looker Studio. This capability matters significantly for organizations with existing enterprise BI infrastructure, where ITSM data needs to combine with financial, HR, or operational data from other systems to create genuinely comprehensive business performance dashboards. ManageEngine also offers an advanced analytics solution called ManageEngine Analytics Plus. This product serves as a native extension to the ManageEngine ecosystem. It includes prebuilt connectors that simplify data integration. As a result, organizations can access deeper analytics without developing custom APIs or building integrations from scratch. This helps reduce implementation time and technical complexity. Freshservice provides a Freshworks Analytics connector and pre-built Power BI templates that accelerate integration for Microsoft-aligned enterprise environments.
Why Do ITSM Leaders Partner With Solution for Guru to Build Their Reporting Strategy?
Designing and implementing an ITSM reporting strategy that genuinely serves leadership — from real-time operational dashboards through to quarterly executive business reviews — requires a combination of ITSM process expertise, platform configuration skills, stakeholder management capabilities, and data visualization knowledge that few organizations have ready-made in their internal IT teams.
That’s precisely why forward-thinking ITSM leaders choose to partner with Solution for Guru. As a specialized digital solutions partner with deep expertise in ITSM platforms including ManageEngine and Freshservice, Solution for Guru brings both the technical implementation skills and the strategic consulting framework to deliver reporting systems that transform how your leadership team uses data.
Here’s the concrete value that ITSM organizations gain by working with Solution for Guru:
- Stakeholder needs analysis: Solution for Guru conducts structured interviews with each audience layer — from service desk managers to the CIO — to identify the exact decisions your dashboards must support, ensuring that every metric earns its place before a single widget is configured.
- Platform selection guidance: For organizations evaluating ManageEngine vs. Freshservice, Solution for Guru provides objective, evidence-based platform selection advice based on your specific organization size, ITIL maturity level, existing technology stack, and reporting complexity requirements.
- Phased implementation delivery: Solution for Guru’s structured implementation methodology delivers the operational foundation first, then progressively builds tactical, strategic, and executive reporting layers — generating value at each phase without the disruption of a full simultaneous deployment.
- Integration architecture: Solution for Guru designs and implements connections between ManageEngine or Freshservice and your existing enterprise BI tools — Power BI, Tableau, or Zoho Analytics — creating a unified operational intelligence layer that covers your entire organization.
- Training and enablement: They train your ITSM team on dashboard management, report creation, and continuous improvement practices — ensuring your organization maintains and evolves its reporting capability independently after implementation.
- Ongoing optimization partnership: As your ITSM maturity grows and your strategic priorities evolve, Solution for Guru continues as a trusted advisor — refining dashboards, adding new reporting capabilities, and ensuring your measurement framework stays aligned with organizational goals.
In short, Solution for Guru bridges the gap between the reporting capabilities these platforms provide and the strategic intelligence your leadership team actually needs. The investment pays back rapidly — in clearer decisions, faster issue escalation, stronger stakeholder confidence, and a measurable improvement in ITSM performance across every metric that matters.Partner With Solution for Guru →
Recommended:
- What Are ITSM KPIs and Why Do They Matter for Your IT Organization?
- What Is a Self-Service Portal in ITSM and Why Does Your Business Need One?
- ESM vs ITSM: What Is the Difference and Which One Does Your Business Need?
- Freshservice for Non-IT Departments: HR, Facilities, Finance, and Operations
- Can Freshservice Reduce IT Operational Costs?
- ITSM Workflow Optimization Strategies for Hybrid Work Environments
- Breaking Down the ITSM Model: What Are the Core Processes, Roles, and Value Streams?
- Common ITSM Deployment Mistakes Businesses Make — and How to Avoid Them
- ITSM for DevOps Teams: Bridging Agile and Service Management
- Event-Driven ITSM: How Do You Connect Monitoring Alerts to Automated Ticketing?
- Integrating Monitoring Tools with ManageEngine or Freshservice for Proactive Support
- Freshservice Asset Management vs ManageEngine Asset Discovery
- On-Premise vs Cloud ITSM: Choosing Between ManageEngine and Freshservice Architectures
- Freshservice for Internal IT Support: What Problems Does It Solve?
- How Does Freshservice Simplify IT Service Management for Modern Organizations?
- How Do Businesses Integrate Slack and Microsoft Teams with ITSM Platforms?
- Automating Software License Tracking with ITSM Solutions: How Can You Take Control?