Real-Time Analytics and Reporting in Creatio
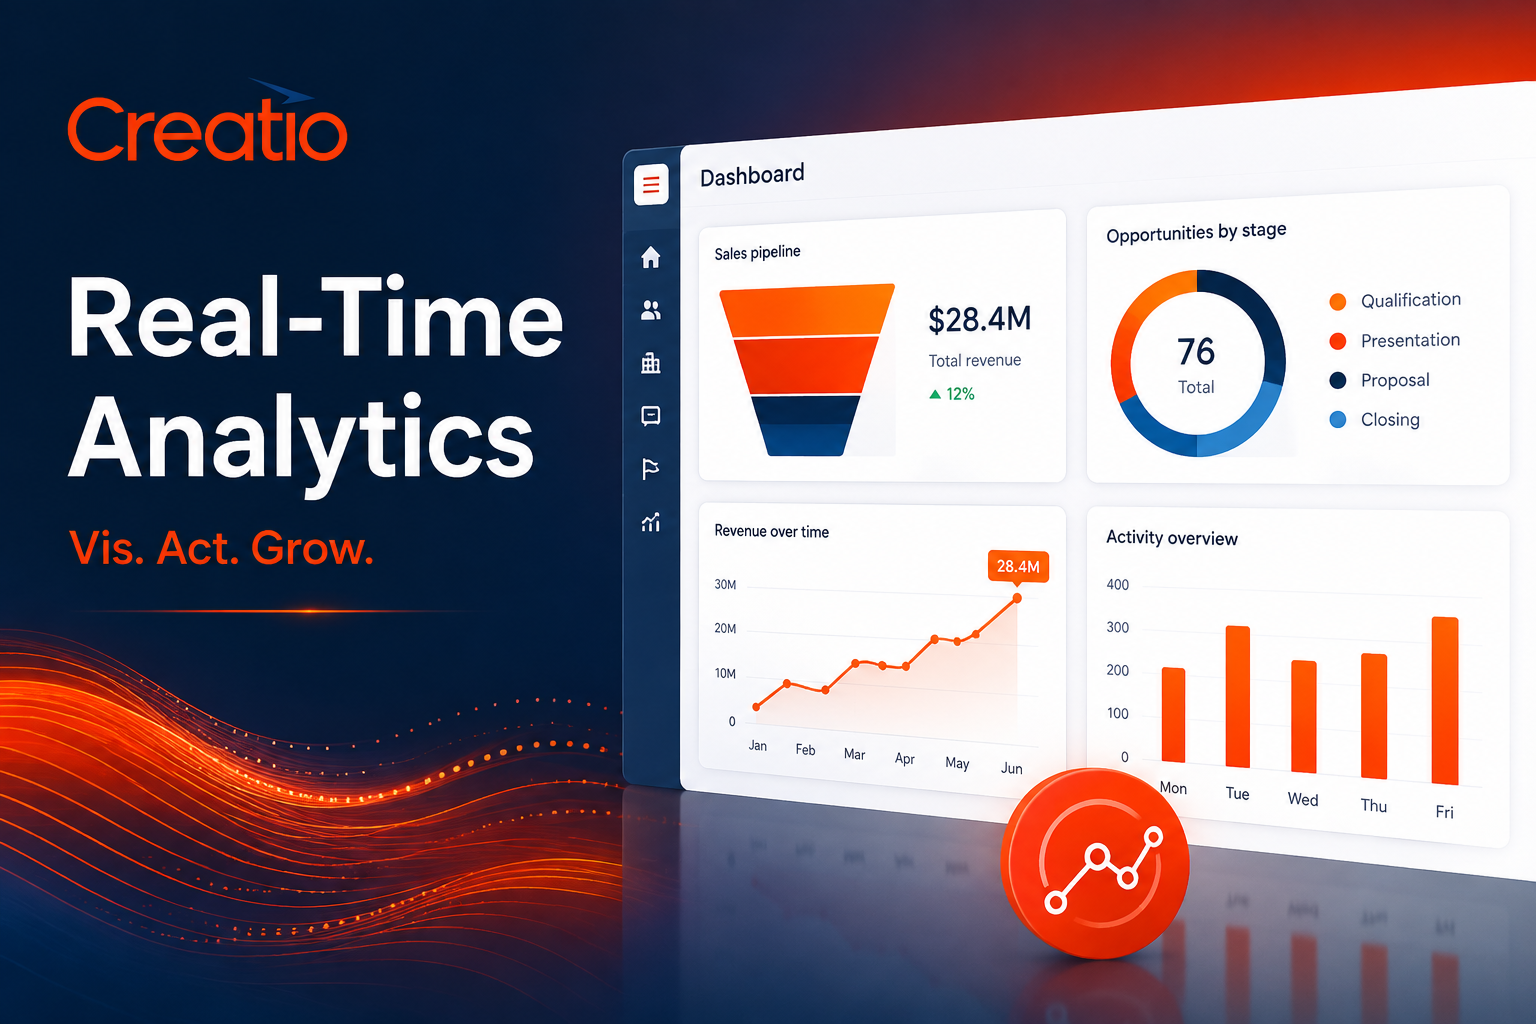
Decisions made on stale data are, by definition, decisions made too late. Sales managers who only see last week’s pipeline, marketing teams who wait until month-end for campaign results, and service leaders who discover an SLA breach after the fact are all working with the same core problem: information arriving too slowly to act on. As customer expectations rise and competitive pressure increases, the gap between when something happens and when a team finds out about it has become one of the most important, and most fixable, sources of business risk. This article looks specifically at how Creatio CRM approaches real-time analytics and reporting, walking through the dashboards, KPI tracking, and AI-driven insights that let teams see what is happening as it happens, rather than reconstructing it afterward. It also explains how partnering with Solution for Guru can help businesses configure these tools to match their exact reporting needs.
Table of contents
Quick Summary: What Does This Article Cover?
Before diving into the details, here is a quick overview of what real-time analytics and reporting look like in Creatio:
- Customizable dashboards that visualize sales, marketing, and service KPIs as data updates
- A no-code, drag-and-drop report builder that lets non-technical users design their own reports
- AI-driven forecasting that uses historical and current pipeline data to predict outcomes
- Role-based access controls that keep sensitive reporting data limited to authorized users
- Native integrations with external BI tools such as Microsoft Power BI
- Process analytics that reveal bottlenecks across sales, marketing, and service workflows
Together, these capabilities turn Creatio CRM from a system that simply stores customer data into a live performance management layer. The sections below explain how each capability works in practice.
How Is Creatio CRM Related to Real-Time Analytics and Reporting?

Creatio CRM is a no-code CRM and business process automation platform that unifies sales, marketing, and service data inside a single database. Because every interaction, deal, campaign, and support case lives in one connected system rather than scattered across separate tools, the platform is naturally positioned to power real-time analytics and reporting, since there is no need to manually merge data from disconnected sources before a report can be generated.
Real-time analytics and reporting is not a bolt-on feature within Creatio; it is one of the platform’s core pillars, alongside no-code customization and end-to-end workflow automation. Built-in analytics, reporting, and KPI monitoring tools cover common CRM scenarios out of the box, while a no-code dashboard designer lets teams build custom, vertical-specific views without waiting on developers. This combination is precisely why the topic of this article, real-time analytics, connects so directly to the platform itself, rather than being a feature that happens to exist alongside an otherwise unrelated CRM.
Why Does Real-Time Analytics Matter for Modern Businesses?
Before examining Creatio’s specific tools, it helps to understand why real-time analytics has become a competitive necessity rather than a nice-to-have. Businesses that rely on outdated or manually compiled reports tend to run into the same recurring problems:
- Decisions get made on data that is days or weeks old, missing emerging trends
- Manual report compilation consumes hours that could go toward higher-value analysis
- Bottlenecks in sales, marketing, or service workflows go unnoticed until they cause visible damage
- Leadership teams lack a single source of truth, leading to conflicting numbers across departments
Consequently, businesses increasingly expect their CRM to double as a live performance management tool, not just a system of record. This shift in expectations is exactly what has pushed platforms like Creatio to build analytics so deeply into the core product, rather than treating reporting as an afterthought bolted on at the end of development.
It is also worth noting that the cost of delayed insight compounds over time. A pricing error caught within a day is a minor correction; the same error left unnoticed for a month can mean dozens of invoices need to be reissued. Similarly, a marketing campaign underperforming against its target is far easier to adjust mid-flight than to salvage after the budget has already been spent. Real-time analytics essentially compress the feedback loop between action and insight, giving teams the chance to correct course while correction is still cheap.
Which Business Scenarios Benefit Most From Real-Time Analytics in Creatio?

While every department can benefit from faster insight, a few specific scenarios illustrate just how directly real-time reporting affects day-to-day operations.
- Sales teams tracking pipeline movement and forecast accuracy throughout the quarter, not just at quarter-end
- Marketing teams monitoring campaign engagement live, allowing budget reallocation mid-campaign rather than after it ends
- Service teams watching SLA performance and case volume in real time, catching backlogs before they trigger a breach
- Leadership teams reviewing a unified dashboard that spans sales, marketing, and service instead of stitching together separate departmental reports
- Operations teams identifying workflow bottlenecks as they emerge, rather than during a quarterly retrospective
Global manufacturing companies that have consolidated multiple regional CRMs into a single Creatio CRM deployment have reported meaningfully improved transparency into where their real sales opportunities are located, allowing decisions to happen faster and with greater accuracy. This kind of outcome illustrates the real-world value of connecting previously siloed data into one live reporting layer.
What Real-Time Analytics and Reporting Capabilities Does Creatio Offer?
Creatio CRM organizes its analytics capabilities around a few core building blocks: dashboards, reports, KPI tracking, AI-driven insights, and access controls. Rather than treating these as separate modules, the platform links them together so that a single underlying data model powers every dashboard and report a team builds. The subsections below explain how each building block works.
How Do Customizable Dashboards Work in Creatio?
First and foremost, dashboards are the most visible expression of real-time analytics inside Creatio. Users can customize their home dashboard, arranging widgets and data visuals based on what matters most to their specific role. A sales manager might prioritize pipeline value and win rates, while a service leader might focus on case volume and average resolution time.
Because dashboards update as underlying records change, rather than on a fixed refresh schedule, teams see genuinely current information instead of a snapshot from the previous business day. Widgets can display charts, graphs, and KPI tiles, which makes it easy to interpret trends at a glance without digging through raw data tables. Additionally, custom fields, objects, and workflows created elsewhere in the platform can also feed directly into dashboard widgets, so analytics stay aligned with how a specific business actually operates rather than a generic template.
This alignment between customization and analytics is one of the more underappreciated advantages of a no-code CRM. In many traditional systems, adding a custom field or process stage means analytics quietly fall out of sync, since dashboards were built around the original data model. Because Creatio’s dashboards are built on top of the same no-code framework as its custom objects and workflows, reporting tends to stay accurate even as a business’s processes evolve over time.
How Does the No-Code Report Builder Work?
Beyond dashboards, Creatio’s drag-and-drop report builder lets users design detailed reports tailored to sales, marketing, service, or RevOps teams without writing a single line of code. Because the tool is no-code, business users can build and adjust reports themselves instead of submitting a request to IT and waiting for a developer to become available.
This flexibility matters most when reporting needs change quickly. If a new campaign requires a custom conversion metric, or a service team wants to track a new SLA tier, the report builder allows that change to happen the same day, rather than becoming a multi-week development project. Consequently, organizations that adopt Creatio often describe the platform as delivering reporting flexibility that would otherwise require a dedicated development team to maintain.
How Does Creatio Support KPI Monitoring Across Teams?

Furthermore, Creatio’s analytics extend beyond sales pipeline tracking into marketing and service operations as well. Teams can monitor campaign engagement and conversion rates, track service case volume and SLA performance, and analyze workflow bottlenecks across departments, all from within the same connected platform.
For leadership teams specifically, this cross-functional visibility can turn Creatio into a genuine performance management layer rather than a departmental tool. Instead of pulling separate reports from marketing automation software, a helpdesk system, and a sales pipeline tool, a single custom dashboard can surface all three data sets side by side, making it far easier to spot where one team’s bottleneck is quietly affecting another’s results.
How Does Process Analytics Reveal Workflow Bottlenecks?
In addition to tracking outcome-focused KPIs, Creatio’s business process management tools include process analytics designed specifically to surface inefficiencies within a workflow itself. Because the platform’s visual process designer models each stage of a sales, marketing, or service workflow, it can also measure how long records spend at each stage and where they most frequently stall.
This distinction matters because outcome metrics alone, such as total closed deals, do not explain why performance changed. Process analytics fill that gap by showing, for example, that deals are not closing more slowly because of lost interest, but because approvals are sitting unresolved for days at a particular stage. Armed with that detail, a manager can address the actual bottleneck rather than guessing at the cause.
How Does AI Enhance Creatio’s Analytics and Forecasting?
Artificial intelligence adds a predictive layer on top of Creatio’s standard reporting. The platform uses historical data and current pipeline information to generate sales forecasts, analyzing patterns and trends to produce more accurate estimates than a manager might reach through intuition alone. Machine learning models can also automatically score leads, flagging the most promising opportunities as they reach a defined threshold.
Because these AI-driven insights are generated continuously as new data arrives, rather than recalculated only during a periodic review, forecasts stay current with the latest pipeline activity. This is particularly valuable for sales leaders who need to adjust territory or resourcing decisions quickly, since waiting for a monthly forecast update can mean missing a meaningful shift in deal momentum.
Lead scoring works in much the same continuous fashion. As new interactions, form fills, or engagement signals arrive, the underlying model reassesses a lead’s score in real time rather than waiting for a nightly batch process. Sales representatives, as a result, spend their time on the opportunities most likely to convert right now, instead of working from a static priority list that may already be outdated by the time they pick up the phone.
How Does Creatio Integrate With External BI Tools?
Not every organization wants to build every report natively inside its CRM, and Creatio accommodates that reality through integration rather than resistance. The platform connects with external analytics tools, including Microsoft Power BI, allowing businesses to combine CRM data with broader operational or financial data sets for a more holistic view.
This matters especially for larger organizations that already maintain a centralized business intelligence practice. Rather than forcing analysts to abandon existing BI workflows, Creatio’s integration options let CRM data flow into those established tools, so businesses get the benefit of real-time CRM data without having to rebuild their entire analytics stack around a single vendor.
REST, SOAP, and OData APIs further extend this flexibility, supporting connections to ERP systems, payment platforms, call center software, and other analytics tools beyond Power BI alone. For organizations with a mature data infrastructure already in place, this API-first approach means CRM analytics can become one input into a much larger business intelligence picture, rather than existing as an isolated silo of customer data.
How Does Role-Based Access Protect Reporting Data?
Finally, real-time visibility only works well if it is paired with appropriate access controls. Creatio supports role-based access to reports and dashboards, ensuring that only authorized individuals can view or edit specific data based on their position or function. This limits unnecessary exposure of sensitive information, such as detailed compensation-linked pipeline data, to employees who do not need it for their role.
In regulated industries, this access control layer also supports broader compliance objectives, since restricting who can view certain reports reduces the risk of unauthorized data exposure. Businesses operating under frameworks such as GDPR benefit directly from being able to demonstrate that sensitive reporting data is genuinely limited to the people who need it.
How Does Creatio Compare to Other CRMs for Analytics and Reporting?
Because most modern CRMs advertise some form of analytics, it helps to compare Creatio against a few well-known alternatives on specific, concrete criteria rather than general marketing claims.
| Platform | Reporting Strength | Notable Trade-off |
|---|---|---|
 | No-code drag-and-drop builder; AI forecasting; cross-department dashboards | Learning curve for teams new to no-code configuration |
 | Deep customization via Tableau integration | Higher cost, best suited to large enterprise budgets |
 | User-friendly prebuilt and custom reports | Less depth for complex, multi-department analytics |
 | Customizable analytics at a lower price point | Shallower AI-driven forecasting than Creatio |
 | Native Power BI, Excel, and Teams integration | Reporting depth often tied to broader Microsoft ecosystem investment |
Across these comparisons, Creatio CRM tends to stand out for organizations that want deep reporting flexibility without depending on developers, particularly mid-market and enterprise teams running complex, cross-department workflows. That said, businesses with very simple reporting needs may find lighter-weight platforms easier to adopt initially.
What Challenges Should Businesses Prepare For When Using Creatio Analytics?
Even a genuinely capable analytics platform runs into predictable obstacles if a business is not prepared for them. Understanding these challenges ahead of time helps teams avoid common implementation mistakes and set realistic expectations for the first few months of use.
- Inaccurate, outdated, or incomplete CRM data leads to unreliable reports regardless of how good the tooling is
- Teams without a defined CRM owner often build inconsistent dashboards across departments
- New users can feel overwhelmed by the platform’s extensive customization options
- Occasional performance issues, particularly page load times, have been noted by some users on data-heavy dashboards
Fortunately, most of these challenges are process problems rather than product limitations. Regularly auditing and cleaning CRM data, automating data entry where possible, and assigning clear ownership over dashboard governance address the majority of these issues before they affect report accuracy.
It is also worth setting expectations around the platform’s learning curve. Because Creatio offers such extensive configuration options, new users sometimes need more onboarding time than they would with a simpler, more rigid CRM. Businesses that budget for this learning period upfront, rather than expecting instant proficiency, generally reach full analytics adoption faster than those that treat training as optional.
How Can Businesses Get the Most Value From Creatio’s Real-Time Reporting?

Getting genuine value from real-time analytics requires more than simply turning the feature on. Success depends far more on preparation and governance than on the underlying technology itself. The following practices consistently help organizations extract more value from Creatio’s reporting tools:
- Define a clear CRM owner responsible for dashboard structure, governance, and adoption
- Clean and standardize data before migration, removing duplicates that would otherwise skew reports
- Map sales, marketing, and service workflows before building dashboards, so analytics reflect real processes
- Review dashboards weekly to catch bottlenecks and adoption gaps early
- Train each team by role, focusing on the specific reports and KPIs relevant to their daily work
Businesses that follow this approach tend to get considerably more value out of Creatio CRM than those that customize dashboards first and define processes later. In other words, process clarity should come before customization, not after.
Why Does Real-Time Analytics Make Creatio CRM a Stronger Business Platform?
Ultimately, real-time analytics and reporting elevate Creatio CRM from a customer data repository into a genuine performance management layer for sales, marketing, and service teams. Customizable dashboards, a no-code report builder, AI-driven forecasting, and role-based access controls work together so that decision-makers see what is happening now, not what happened weeks ago.
For businesses evaluating whether Creatio CRM fits their needs, the honest answer depends on how much they value reporting flexibility versus simplicity. Organizations with straightforward, single-department reporting needs may not need everything Creatio offers. However, for mid-market and enterprise teams managing complex, cross-functional operations, the platform’s real-time analytics can meaningfully shorten the distance between a problem occurring and a team noticing it, which is often the single biggest factor separating a proactive business from a reactive one.
As data volumes continue to grow and customer expectations for fast, personalized service keep rising, the ability to see, understand, and act on information in real time will likely become even more central to CRM buying decisions. Platforms that treat analytics as a core architectural principle, rather than an add-on module, are best positioned to keep pace with that trend, and this is precisely the category Creatio has built itself around.
Frequently Asked Questions
No. Creatio’s report and dashboard builder is designed as a no-code, drag-and-drop tool, which means business users can create and adjust reports without relying on developers. That said, more advanced custom applications built on top of the platform may still benefit from technical expertise, particularly for organizations with highly specialized data models or complex integration requirements.
Yes. Dashboards can be tailored by role, department, or individual preference, so a sales manager, marketing director, and service lead can each see the KPIs most relevant to their responsibilities. Because dashboards draw from the same underlying database, teams still work from a single, consistent source of truth even though each view looks different. This also means that when underlying data changes, every dashboard built on top of it reflects that change immediately, without requiring a manual sync between departmental views.
Yes. Creatio supports integration with external analytics platforms such as Microsoft Power BI, allowing organizations to combine CRM data with broader business intelligence workflows rather than replacing their existing BI investment entirely. This approach tends to appeal to larger organizations that have already standardized on a specific BI tool and want CRM data to feed into that existing environment rather than creating a separate reporting silo.
What Are the Benefits of Partnering With Solution for Guru?
Even the most capable analytics platform depends on thoughtful setup to deliver real value. That is where Solution for Guru comes in. As a CRM and software implementation consultancy, Solution for Guru helps businesses configure platforms like Creatio CRM so that dashboards, reports, and KPIs reflect real operational workflows from the very first rollout, rather than requiring a costly redesign months later.
Specifically, working with Solution for Guru offers several advantages:
- Process mapping support before dashboard customization begins, so analytics reflect actual business workflows
- Data cleanup and migration guidance to prevent duplicate or inconsistent records from skewing reports
- Hands-on training by role, helping each team get comfortable with the specific reports that matter to them
- Ongoing advisory support as reporting needs evolve alongside a growing business
In short, pairing Creatio CRM with expert guidance from Solution for Guru helps businesses move past the platform’s learning curve faster and start making genuinely data-driven decisions sooner, rather than spending months discovering best practices through trial and error.
Whether a business is implementing Creatio CRM for the first time or looking to get more value out of an existing deployment, Solution for Guru brings the process discipline and platform expertise needed to turn real-time analytics from a technical capability into a genuine day-to-day advantage.
Recommended:
- Why CRM Skills Matter More Than Ever in Financial Services
- Is Bigin by Zoho CRM a Good Choice for Small Businesses?
- Bigin by Zoho CRM for First-Time CRM Users: A Beginner’s Guide
- Zoho CRM Webhooks and API Integrations
- Creatio CRM Integration with ERP Systems
- API Capabilities in Creatio: What Developers Should Know
- Using Creatio to Improve B2B Sales Performance
- What Is Pipedrive Pipeline Management and How Does It Help Your Team Close More Deals?
- Pipedrive Google Workspace Integration: How Does It Transform Sales Productivity?
- What Is the Pipedrive LeadBooster Add-On and How Can It Transform Your Sales Process?
- Why Pipedrive Implementations Fail: The Top 7 Mistakes and How to Avoid Them
- CRM Systems: How to Make Your Business More Efficient?
- What Are the Best CRM Systems for Service Businesses?
- Account-Based Marketing Strategies with Creatio
- Modern CRM Teams: How Are Roles Evolving in the Digital Era?
- CRM Automation for Logistics Companies Using Creatio